
Key takeaways
- The Question: Which numbers should a construction progress monitoring routine produce, and how do you prove each one from the site rather than accepting it on trust?
- The Answer: Most projects report five measures: physical percent complete, installed quantities, milestone completion, earned value and schedule variance. Each one needs a written definition, a source of site evidence that can confirm it, a named reader and a cadence matched to the decision it feeds.
- The YelloSKYE Angle: Drone, 360° and fixed-camera capture under Construct IQ is timed to the reporting calendar, and the DEX platform holds the dated evidence next to the programme, so each figure can be tested against the built work.
Construction progress monitoring is the routine of measuring how much of a project has been built, checking those measurements against evidence from the site and passing the results to the people who pay, plan and fund the work. The useful way to set it up is backwards from the numbers: decide which measures your project reports, then decide how each one will be proved. With Construct IQ, our construction monitoring solution, capture is planned around the figures a project has to report, with drone flights timed to billing cycles where payment depends on them.
This guide is the starting point for our progress topics. It covers the five measures most project teams report, the site evidence that verifies each of them, who consumes them and how often, then shows how to run the monitoring cycle and what a reporting table can look like. Where a measure has its own detailed guide, we link to it rather than repeat it.
Start with the measure, not the camera
Many monitoring programmes begin with equipment. A drone is bought, captures pile up, and only later does anyone ask which number the images are meant to support. The result is plenty of evidence and very little proof.
Turning it round gives every capture a job. If the commercial team needs measured earthworks volumes at the end of each claim period, a survey-grade drone flight has to land in the last days of that period. If the owner needs to know the date a milestone was reached, a fixed camera pointed at that area will settle it better than a monthly walk. The measure decides the evidence, the evidence decides the capture method, and the reader decides the cadence.
The five measures at a glance
| Measure | The question it answers | Main site evidence | Main readers | Usual refresh |
|---|---|---|---|---|
| Physical percent complete | How much of the defined scope is finished? | Drone orthomosaics, 360° walkthroughs | Project manager, planner, quantity surveyor | Weekly internally, each claim period formally |
| Installed quantities | How many units, metres or cubic metres are in place? | Drone surface models, survey, laser scans, 360° counts | Quantity surveyor, commercial manager, contractor | Each claim period, weekly for production rates |
| Milestone completion | Has a contractual or programme milestone been reached, and when? | Fixed cameras, dated 360° and drone records | Owner, lender, board, project director | When the event happens, confirmed at the next capture |
| Earned value | Is the value of work done in line with time and money spent? | Verified percent complete and quantities, plus cost ledger | Project controls, finance, owner's representative | Monthly |
| Schedule variance | How far ahead or behind the baseline are key activities? | Dated captures giving actual start and finish dates | Planner, project manager, owner | Weekly for the critical path, monthly for the summary |
The weighting varies by project: on a road job installed quantities carry most of the load, while a fit-out leans on milestones and percent complete by floor.
Physical percent complete
What it answers. The proportion of an activity, area or package that is finished, rolled up to a project figure using weights. It is the measure most people mean when they ask how far along a job is, and the one most often argued over. The methods for calculating it, from counted units to rules of credit for completed steps, are covered in our guide to percent complete in construction.
How site evidence verifies it. The figure is only checkable if "finished" is defined in terms a camera or a survey can see: formwork struck, blockwork to soffit, first fix closed up. With that definition agreed, a drone orthomosaic shows completed slabs, roofs and external areas across the whole site in one dated image, and a 360° walkthrough along a fixed route does the same for each interior floor. The verifier compares the claimed percentage for each area with what the record shows on the same date.
Who reads it, and how often. Project managers and planners use it weekly to steer the work. Quantity surveyors and owner's representatives use it formally once per claim period, which is why one capture should fall as close as possible to the claim cut-off.
Installed quantities
What it answers. The physical amount of work in place, in its natural unit: cubic metres of fill, square metres of paving, linear metres of pipe, number of piles or façade panels. Quantities are less open to interpretation than percentages, and they feed straight into measured payment and production rates.
How site evidence verifies it. This is where measurable capture earns its place.
- Drone surface models. For bulk earthworks, a drone survey produces a surface that can be compared with the previous survey or the design level to give cut and fill. YelloSKYE states earthwork volumes to within 1 to 3 per cent of traditional survey methods, using RTK-GNSS drones and ground control points for ±2–3 cm positional accuracy. Our guides to cut and fill volumes and stockpile volume measurement explain the method in detail.
- Orthomosaics. Areas and lengths, such as paving laid or kerbs installed, can be measured from a scaled, georeferenced image. Our explainer on what an orthomosaic is covers why that image can be measured and an ordinary photo cannot.
- Laser scans and survey. Where tolerances are tight or work is about to be covered, a scan or conventional survey records exact positions and dimensions.
- 360° counts. For repetitive interior items such as sprinkler heads, sockets or door frames, a walkthrough lets the verifier count installed units by room without a site visit.
The earthwork volumetric analytics use case shows how measured volumes replace estimated ones in contractor payments.
Who reads it, and how often. Commercial teams read it once per claim period. Site managers often want weekly quantities so they can calculate production rates and see early whether a crew is keeping pace.
Milestone completion
What it answers. Whether a defined event has happened, and on what date: substructure complete, topping out, building weathertight, energisation, practical completion. Milestones are binary, which makes them attractive to owners and lenders, but they are only as solid as the acceptance criteria written for them.
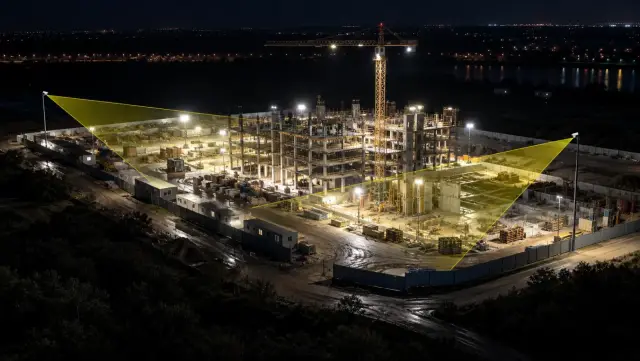
How site evidence verifies it. Write each milestone so its completion leaves a visible trace. "Roof weathertight" can be confirmed from a drone image showing the membrane complete and openings closed. A fixed camera trained on the right zone records the day the last structural element went in, which settles any argument about dates; the fixed-camera construction monitoring use case describes that kind of milestone record. For milestones that depend on concealed work, such as services tested before ceilings close, a 360° record made before and after closing is the only evidence that will still exist later.
Who reads it, and how often. Owners, lenders and boards, because milestones often trigger funding releases or milestone payments. It is reported when the event happens and confirmed at the next scheduled capture.
Earned value
What it answers. Whether the value of the work done matches the time elapsed and the money spent. Earned value multiplies verified progress by budget to give an earned figure, then sets it against planned value and actual cost. The schedule performance index (earned value divided by planned value) and the cost performance index (earned value divided by actual cost) turn that into two ratios that can be tracked month by month. Our guide to earned value management in construction sets out every formula with a worked example.
How site evidence verifies it. Earned value is not captured on site at all. It is calculated from other measures, so it can only be as good as its inputs. If percent complete and installed quantities have been verified against dated evidence, the earned figure inherits that reliability. If they are self-reported, the indices look precise while carrying the same optimism. The practical rule is to verify the physical inputs first and calculate second.
Who reads it, and how often. Project controls teams, finance and owner's representatives, normally monthly, in step with the cost ledger. Calculating it more often than costs are posted produces noise rather than insight.
Schedule variance
What it answers. How far key activities are ahead of or behind the baseline programme, expressed in days. This is different from the schedule variance in earned value, which is measured in money and tends towards zero as a project finishes regardless of how late it is. For monitoring, the time-based version on critical and near-critical activities is the one that predicts the completion date.
How site evidence verifies it. Variance depends on actual start and finish dates, and those are exactly what dated captures provide. A fixed camera shows the day a crew mobilised on an area. Successive drone flights show when a slab cycle started to slip. Construct IQ compares actual execution against the planned schedule in 4D, and DEX displays planned and actual progress curves so the lag is visible by zone. Feeding those dates into the programme is covered in our guide to construction schedule updates.
Who reads it, and how often. Planners and project managers weekly, for the critical path. Owners usually see a monthly summary with the forecast completion date and the activities driving any slippage.
Which evidence supports which measure
No single capture method covers all five measures. The table shows where each one is strong and where it runs out.
| Evidence source | Strongest for | Weak or blind for |
|---|---|---|
| Drone orthomosaic and surface model | Installed quantities outdoors, percent complete of structure and external works, site-wide schedule variance | Anything under a roof or behind cladding |
| 360° walkthrough | Interior percent complete, counts of installed items, records before work is concealed | Measured volumes and site-wide context |
| Fixed camera | Milestone dates, start and finish dates for schedule variance, crew activity between flights | Quantities and areas outside its field of view |
| Laser scan or conventional survey | Precise as-built geometry, tolerance checks, quantities where accuracy matters most | Frequent capture across a large site |
| Daily records and site diaries | Context, causes of delay, labour and plant on site | Independent verification of anything the author is paid for |
For the aerial part of this mix, our guide to drone construction progress tracking explains flight setup and cadence. For interiors, see 360 cameras for construction, and for fixed units, construction site cameras. Laser scanning sits within YelloSKYE's BIM IQ solution, and the DEX platform brings drone, 360°, laser scan and BIM data into one environment.
Setting up the monitoring cycle
A monitoring cycle is the repeating loop of capture, measurement, reconciliation and reporting. Four decisions at the start make it run without constant effort.
Write the definitions at mobilisation
Agree with the contractor, in writing, what "complete" means for each reported element, how percent complete is weighted and which milestones carry acceptance criteria. Definitions agreed before the first claim are far easier to hold than definitions negotiated during a dispute.
Build the capture calendar from the reporting calendar
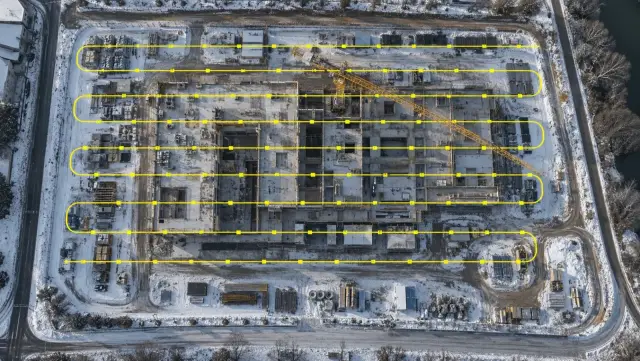
List the reporting dates first: weekly progress meetings, claim cut-offs, monthly owner reports, lender drawdowns. Then place each capture just before the date it serves. Drones on Construct IQ projects fly pre-programmed routes weekly or every two weeks. In our contractor billing disputes use case, flights were timed to coincide with billing cycles, and verification needed 80 per cent fewer site visits.
Keep a reported figure and a verified figure
For every measure, record two numbers each period: what was claimed and what the evidence supports. The difference is a measure in its own right. A persistent gap on one package points to a definition problem or a contractor under pressure, and both are better found early. Comparing manual and assisted checking methods is the subject of our guide to AI versus manual progress verification.
Set escalation thresholds in advance
Decide what size of gap or slippage triggers action, and who acts. Without thresholds, every variance becomes a discussion; with them, the weekly review can spend its time on the few items that crossed the line.
On a portfolio, the same definitions and capture parameters should apply on every site so leadership compares like with like. In our portfolio monitoring use case, that standardisation let leadership review more than ten sites in 30 minutes.
A progress reporting template
The table below is a reporting layout that keeps each measure tied to its evidence. Square brackets mark values your team fills in each period. The fuller monthly report for owners and lenders, with cost, risk and safety sections, is set out in our construction progress report guide.
| Measure | Reported this period | Verified this period | Last period (verified) | Evidence reference | Action and owner |
|---|---|---|---|---|---|
| Percent complete, by package or zone | [contractor figure] | [figure from capture] | [figure] | [drone flight date, 360° route ID] | [who resolves any gap, by when] |
| Installed quantities, key items | [claimed units] | [measured units] | [units] | [survey or scan reference] | [action] |
| Milestones due this period | [claimed status] | [achieved or not, with date] | [status] | [fixed camera clip, dated image] | [action] |
| Earned value indices | [SPI, CPI] | [recalculated on verified inputs] | [SPI, CPI] | [cost ledger date] | [action] |
| Schedule variance, critical path | [days] | [days from actual dates] | [days] | [capture dates used] | [action] |
Two habits make the template work. Never leave the evidence column empty, because a figure without a reference is an opinion. And show last period beside this one: a single month's gap may be noise, but the same gap three months running is a pattern.
The aerial progress capture use case shows what this kind of evidence-backed reporting can change: site managers saved more than 15 hours a week, and stakeholder meetings dropped from two hours to 30 minutes.
Before the numbers go out: a pre-report checklist
- Every reported measure has a written definition that the contractor has accepted.
- The latest capture for each measure falls within a few days of the reporting cut-off.
- Reported and verified figures are both shown, and every gap has a named owner.
- Each figure in the table carries an evidence reference that a reader can open.
- Earned value has been recalculated on verified inputs, not on claimed ones.
- Schedule variance uses actual dates taken from dated captures, not from memory.
- Milestones are marked achieved only where the acceptance criteria are visibly met.
- The same capture routes and parameters were used as last period, so the comparison is fair.
If any line fails, fix the evidence before the report is issued, not after someone questions it.