Stockpile Volume Measurement with Drones: Base Surfaces, Accuracy and Inventory Reconciliation
By Kush Agarwal, President and CEO, YelloSKYE. Published .
Executive Summary
- The Question: How do you measure the volume of a stockpile with a drone, and how do you make the result good enough to reconcile against inventory or pay against?
- The Answer: A drone flight produces a 3D surface of the pile; the volume is the space between that surface and a base surface you choose. The base choice, the toe outline, ground control and the density used to convert volume into tonnes decide whether the figure holds up when it meets the books.
- The YelloSKYE Angle: Survey IQ measures stockpiles and cut and fill from drone surveys, and the DEX platform keeps each dated surface so a volume can be checked, compared and shared rather than re-argued.
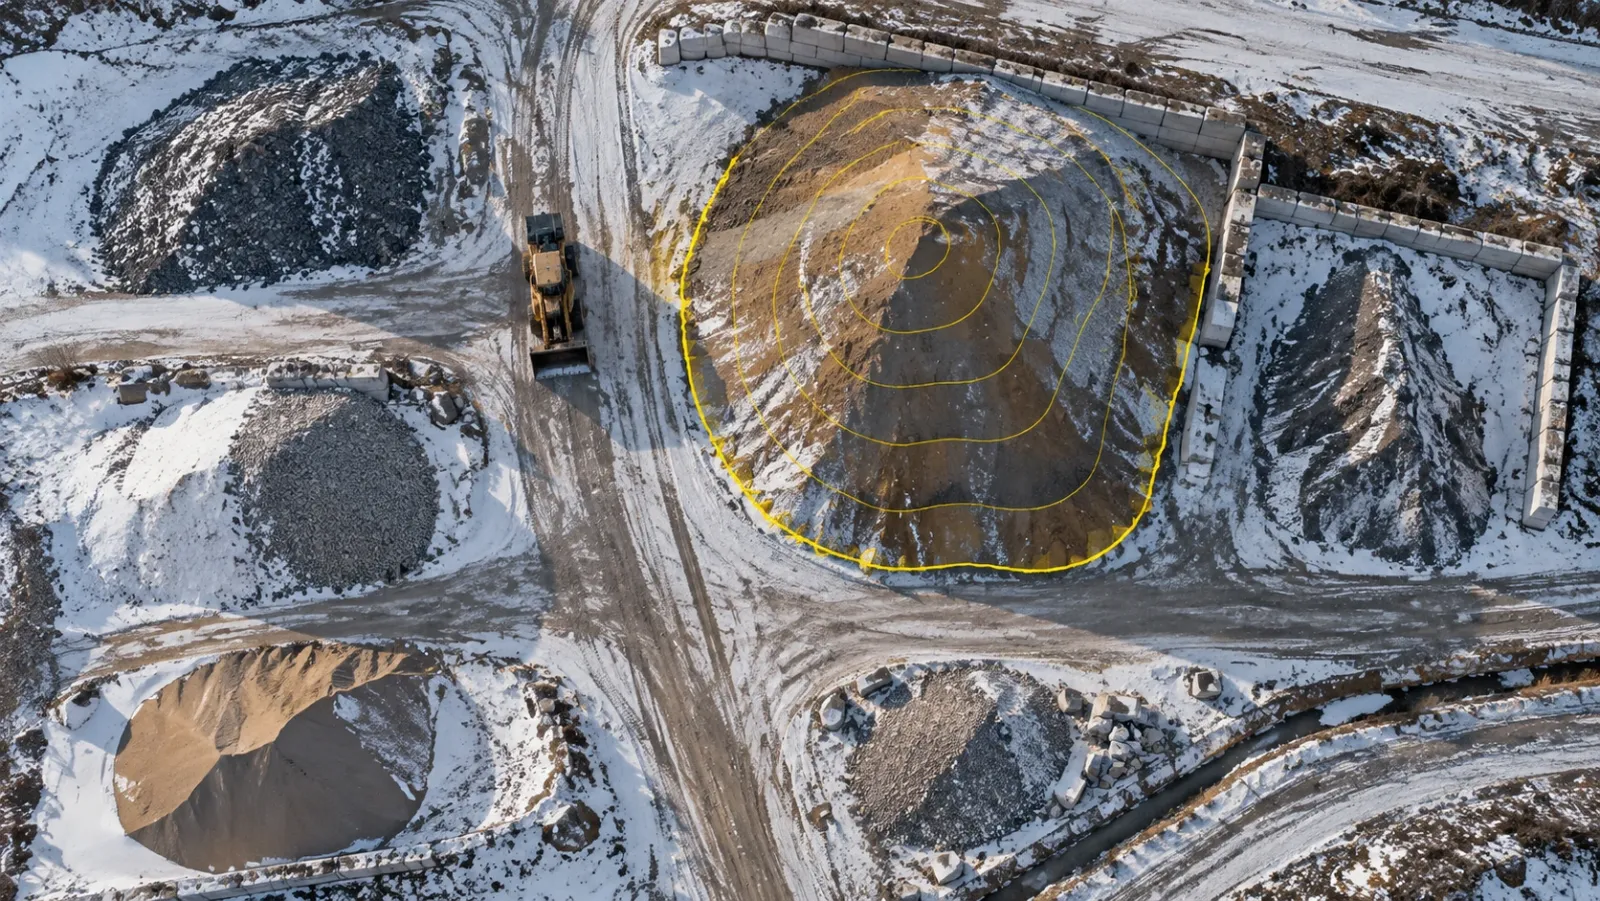
Stockpile volume measurement is the job of working out how much material sits in a pile, usually so that a business can value its inventory or pay for material moved. A drone does this by flying over the pile, building a measured 3D surface from overlapping photos or laser returns, and calculating the space between that surface and the ground beneath it. The flight takes minutes; the judgement lies in defining that ground.
At YelloSKYE, stockpile measurement is part of Survey IQ, alongside topography, cut and fill and change detection. This guide is about the stockpile itself: how to choose the base surface for different kinds of pile, how to plan the capture, what moves the number and how to turn a volume into a figure that reconciles with your inventory records. For what happens inside the processing software, see our guide to drone image processing.
Why stockpile numbers cause arguments
Stockpiles are irregular, change daily, often sit on ground nobody surveyed first, and are valued with a density that is rarely measured. Each method copes with that differently.
| Method | How the pile is measured | Where it struggles | Safety and disruption |
|---|---|---|---|
| Visual estimate | Experienced judgement of shape and size | No audit trail; two people rarely agree | None, but nothing to check later |
| GNSS rover or total station | A surveyor walks the pile and records points on breaks of slope | Sparse points miss hollows and bulges; slow on large yards | Surveyor climbs loose, unstable material |
| Terrestrial laser scanner | Scans from several set-ups around and sometimes on the pile | Tall piles hide their own crest; many set-ups on big sites | Mostly from the ground; some set-ups need access |
| Drone photogrammetry | Overlapping photos turned into a dense surface | Low-texture material, deep shadow, standing water | Flown from the edge of the yard; no one on the pile |
| Drone LiDAR | Laser returns from the air, including through light vegetation | Higher equipment cost; still needs control | Same as photogrammetry |
The drone methods win on two points that matter for stockpiles: they record the whole surface rather than a sample of points, and they keep people off the material.
How a drone turns a pile into a volume
Every stockpile volume is the difference between two surfaces. The top surface comes from the flight: a surface model built from the images or laser points, describing the pile as it stood at that moment. The base surface is the ground the pile rests on, and in most cases nobody can see it because the material is sitting on it.
Software divides the space between them into small cells, multiplies each cell's area by its height difference and adds the results. That arithmetic is reliable. The boundary of the pile and the shape of the base need a person, and that is where most disagreement starts.
Choosing the base surface
The base surface is a model of ground you cannot see. Pick it to match how the pile sits on site, and record which method you used so the next measurement uses the same one.
| Pile situation | Base to use | What goes wrong if you choose badly |
|---|---|---|
| Level hardstanding | Flat plane at the average toe height | If the "level" pad falls towards a drain, the plane cuts into the ground on one side and floats above it on the other |
| Sloping or rough ground | Surface stretched between points traced along the toe | A flat plane adds or loses a wedge of ground; even the stretched surface assumes no hump or hollow under the pile |
| Against a wall or in a bay | Surveyed bay floor, with the walls as edges | The wall is counted as material, or the face stacked against it is missed |
| Pad surveyed before use | The earlier empty-pad surface | Little: this is the most defensible base |
| Material placed on older material | Original ground for totals; last survey for change | Months reported on different bases cannot be compared |
Survey the floor before the material arrives
The most reliable base is one measured while the ground was still visible. A drone survey of an empty pad, laydown area or new stockyard gives a true floor for every later flight. It costs one extra flight and removes the largest assumption from every measurement that follows. Long-lived piles that grew on uncleared material need a clear decision instead: measure against original ground for a total, or against the last survey for the change, and never switch between the two from month to month.
Drawing the toe
The toe is where the pile ends and the yard begins. On a clean pad it is obvious. Where spillage, wheel ruts or a neighbouring pile blur the edge, set a rule (for example, the break of slope rather than the outer limit of loose spill) and apply it the same way every time. Saving the toe outline with the survey means next month's measurement starts from the same line instead of a new interpretation.
Planning the flight and capture
A few decisions at this stage set the ceiling on how good the volume can be.
Coverage of steep faces
Tall conical piles and stacked faces are poorly seen by a camera pointing straight down. Add oblique passes around the pile or a cross-hatched grid so the steep sides are photographed from more than one direction, otherwise the software fills them in by interpolation.
Ground control and checkpoints
Positional error in height turns directly into volume error, so the vertical control matters more here than in most mapping. RTK or PPK positioning on the drone, combined with surveyed ground control, ties the surface to real coordinates; checkpoints that were not used in processing tell you whether it worked. Survey IQ uses RTK-GNSS-equipped drones with ground control points and achieves sub-5 cm horizontal and vertical accuracy.
A still site
Loaders reclaiming from a pile during the flight leave a surface that never existed at any single moment. Agree a short pause in movements on the piles being measured, or fly before the shift starts. Clip parked machines out of the surface.
Weather and surface conditions
Snow, frost heave and standing water all sit on top of the pile and get counted as material. Deep shadow on the shaded side of a tall pile and very uniform material, such as fine sand, give the matching software little to work with. Where you can, fly in even light on a dry surface, and note the conditions in the report when you cannot.
The same route every time
For stock that is measured repeatedly, fly the same area, height and pattern, process with the same control and use the same base and toe rules. Consistency is what makes month-on-month change meaningful.
What affects stockpile accuracy
Small vertical errors become large volume errors because they act over the whole footprint. A height bias of just 2 cm across a pile covering 2,000 m² changes the answer by 40 m³, before anything else has gone wrong. That simple multiplication explains why control and base definition dominate the error budget.
| Factor | Effect on the volume | How to control it |
|---|---|---|
| Base surface choice | Usually the largest single source of difference | Choose by pile situation; record and repeat the method |
| Toe outline | Adds or removes a band of material around the edge | Fixed rule for the edge; reuse the saved outline |
| Vertical accuracy | Height error multiplied by footprint area | RTK or PPK, ground control, independent checkpoints |
| Steep or hidden faces | Interpolated sides under- or over-state the pile | Oblique passes; flight pattern matched to pile height |
| Surface texture and light | Gaps or noise in the surface model | Even light, adequate overlap, dry surface |
| Snow, water, machines | Non-material counted as material | Fly in suitable conditions; clip objects out |
| Density assumption | Wrong tonnes even when the volume is right | Site calibration of bulk density per material |
YelloSKYE's drone-derived earthwork volumes come within 1 to 3 per cent of traditional survey methods. That figure assumes good control and a sensible base; it cannot rescue a base surface that does not describe the real ground.
From cubic metres to tonnes
Inventory and purchase contracts are usually kept in tonnes; a drone measures cubic metres. Bulk density bridges the two, and it is the least measured number in the chain.
Bulk density changes with the material, its grading, its moisture content and how the pile was built. Material tipped loose from trucks sits differently from material that has been tracked over by a dozer. The same soil also occupies different volumes in the ground, in the truck and once compacted, so make sure everyone is talking about the same state of the material.
The practical answer is to calibrate on site. Weigh a set of loads taken from a measured pile, measure the pile again, and divide the weight removed by the volume removed. Repeat when the material source or handling changes, and record the density used next to every volume reported. A volume without its density is only half a stock figure.
Reporting stockpile volumes
A stockpile report should let someone who was not on site understand and repeat the result. At minimum it should show:
- Date and time of capture, and the site conditions at the time.
- Each pile's identifier and material, with its toe outline drawn on the orthomosaic.
- The base method used for each pile and, where relevant, the date of the earlier surface.
- Volume, density used and resulting tonnage, with the change since the previous measurement.
- An accuracy statement based on checkpoint results, not on the equipment specification.
In DEX, the orthomosaic, the surface model and the measured outlines stay attached to the date they were captured, so the next person can open the same pile, see how it was measured and compare it with the previous flight. Survey IQ deliverables also include volumetric reports alongside orthomosaics, terrain and surface models and point clouds, exported in formats such as GeoTIFF, DXF, LAS and PDF.
Reconciling measured stock with inventory
The real test of a stockpile survey is whether it agrees with the books. Book stock is calculated: opening stock, plus receipts, minus dispatches and consumption. Measured stock is what the drone found. The gap between them is the reconciliation variance, and it always exists to some degree.
Where variances come from
- Weighbridge and conveyor scale drift, which shifts receipts or dispatches over time.
- The density assumption, which converts an accurate volume into an inaccurate tonnage.
- Cut-off timing, when material moves between the survey and the accounting close.
- Physical loss, from wind on fine material, run-off, spillage and contamination at the base.
- Allocation errors, where material is booked to one pile or product but placed on another.
A workable reconciliation routine
- Fly as close to the accounting cut-off as possible, and freeze movements on the piles being measured.
- Measure each pile with its agreed base and toe, and convert to tonnes with the current calibrated density.
- Compare measured and book stock pile by pile, not just as a site total, so offsetting errors do not hide each other.
- Agree a tolerance in advance. Inside it, adjust the book to the survey; outside it, investigate before adjusting.
- Keep the survey, the calculation and the adjustment together, so auditors can follow the trail.
A run of dated surfaces also tells you when a pile changed, which is often enough to separate a recording error from a physical loss. Each surface sits on an orthomosaic of the same date, so the outline and the image can be checked together.
The same logic applies to earthwork contracts, where the "book" is the contractor's claim. On one highway project, replacing manual surveys with drone-derived terrain models compared against the design grading plan in DEX gave both sides a figure they could inspect. Our earthwork volumetric analytics use case records zero billing disputes and survey turnaround cut from two weeks to a few hours, with cut and fill balanced on site to reduce paid external hauling. Where volume is one part of a wider payment review, aerial captures aligned with each billing cycle do the same job for progress, as our contractor billing disputes use case shows.
A checklist for your next stockpile survey
- Survey any new pad or yard before material is placed, and keep that surface as the base.
- Write down a base method and a toe rule for each type of pile, and use them every time.
- Fly with RTK or PPK positioning, ground control and independent checkpoints.
- Add oblique coverage for tall piles and stacked faces.
- Pause machine movements on the measured piles during the flight.
- Avoid flying with snow, frost or standing water on the piles, or record it when you must.
- Calibrate bulk density on site for each material and note it beside every tonnage.
- Reconcile pile by pile against book stock, with a tolerance agreed before the numbers arrive.
- Keep each dated surface, outline and report together so the result can be checked later.
Frequently asked questions
How accurate is drone stockpile measurement?
With RTK-GNSS positioning, surveyed ground control and a well-defined base, drone volumes are close enough to support inventory and payment decisions. YelloSKYE's drone-derived earthwork volumes come within 1 to 3 per cent of a traditional survey. The biggest source of error is usually not the drone but the choice of base surface and the outline drawn around the pile.
How do you convert a stockpile volume into tonnes?
Multiply the measured volume by the bulk density of the material as it sits in the pile. Bulk density varies with material type, grading, moisture and how the pile was built, so a figure from a datasheet is only a starting point. Calibrate it on your own site, for example by weighing loads taken from a pile whose volume you have measured before and after.
How often should stockpiles be measured?
Match the cadence to the decision the number supports. Inventory teams usually measure at each accounting close, such as month end or quarter end. Earthwork contractors and project managers often measure on the payment cycle, or more often when material is moving fast and quantities are disputed.
What is the toe of a stockpile?
The toe is the line where the pile meets the surrounding ground. It defines the footprint of the pile and, in most methods, the edges of the base surface used to calculate the volume. Drawing the toe too wide or too tight is one of the most common reasons two people measuring the same pile get different answers.
Can a drone measure stockpiles inside a shed or dome?
Standard survey drones rely on satellite positioning, which does not work reliably indoors, so covered storage is usually measured with a terrestrial laser scanner or a fixed scanning system instead. Open-sided sheds can sometimes be captured from outside with oblique flights, but the roof hides the crest. Check the method against the building before committing to it.