Earned Value Management in Construction: Formulas, a Worked Example and Reliable Inputs
By Kush Agarwal, President and CEO, YelloSKYE. Published .
Executive Summary
- The Question: How do the earned value formulas work on a construction project, and what makes their output trustworthy enough to act on?
- The Answer: Earned value management compares three figures: the value of work planned, the value of work done and the money spent. From them come two variances, two performance indices and a set of forecasts. The arithmetic is simple; the weak point is earned value itself, which rests on a progress figure that is usually estimated rather than checked.
- The YelloSKYE Angle: Construct IQ gives the progress input a dated, measurable source: site captures timed to each cut-off, measured quantities where the work allows and a planned-versus-actual view on DEX.
Earned value management (EVM) is a way of measuring project performance by comparing the value of the work actually completed with the value of the work that was planned and with what that work cost. On a construction project it answers two questions at once: are we ahead or behind, and are we getting the work we are paying for? From there it projects where cost and schedule will finish if current performance continues.
This guide sets out every formula you need, works through an illustrative example on a concrete frame package, and then deals with the part that most EVM explanations skip: where the progress figure comes from. That input is the focus of Construct IQ, YelloSKYE's construction monitoring solution.
The three base figures
Everything in EVM is built from three numbers, each measured at the same status date. Older textbooks and some software still use the longer names in brackets.
| Figure | Older name | What it measures | Where it normally comes from |
|---|---|---|---|
| Planned value (PV) | BCWS, budgeted cost of work scheduled | The budget for work the baseline programme said would be finished by the status date | The cost-loaded baseline programme |
| Earned value (EV) | BCWP, budgeted cost of work performed | The budget for work actually finished by the status date | Percent complete of each activity × its budget |
| Actual cost (AC) | ACWP, actual cost of work performed | The money actually spent to achieve that work | The cost ledger, plus accruals for costs not yet invoiced |
One more figure frames the whole project: budget at completion (BAC), the total baseline budget for the scope being measured.
The three figures answer different questions. PV is the plan, AC is the accounts and EV is the site. Two of them come from systems that already exist on any project. The third has to be measured, and that is the one to watch.
The performance formulas
With PV, EV and AC in hand, four calculations show how the project is performing.
| Measure | Formula | Reads as | Good sign |
|---|---|---|---|
| Schedule variance (SV) | EV − PV | Value of work ahead of or behind plan | Zero or positive |
| Cost variance (CV) | EV − AC | Value of work done above or below its cost | Zero or positive |
| Schedule performance index (SPI) | EV ÷ PV | Pace of work as a fraction of planned pace | 1.0 or above |
| Cost performance index (CPI) | EV ÷ AC | Value of work earned for each unit of money spent | 1.0 or above |
The variances give the size of the problem in money. The indices give its rate, which makes them easier to compare across packages of different sizes. A CPI of 0.90 means that every 100 spent has bought 90 worth of planned work, whether the package is a small fit-out or a large frame.
A caution on schedule variance
SV and SPI measure schedule in money, not in time. They also lose meaning near the end of a project: once all the work is done, EV equals PV and SPI returns to 1.0 even if the project finished months late. Teams that need a time-based measure use earned schedule, a method that converts earned value back into the date by which the baseline planned to earn it. For most mid-project reviews, SPI is still useful, as long as it is read alongside the critical path rather than in place of it.
The forecasting formulas
EVM's real use is in looking forward. These formulas project the finish from performance so far.
| Measure | Formula | Use it when |
|---|---|---|
| Estimate at completion (EAC), CPI method | BAC ÷ CPI | Cost performance to date is likely to continue |
| EAC, one-off overrun method | AC + (BAC − EV) | A past overrun had a specific cause that will not repeat |
| EAC, cost and schedule method | AC + (BAC − EV) ÷ (CPI × SPI) | The project is behind and recovery will cost extra, such as overtime or more crews |
| EAC, bottom-up | AC + a new estimate of remaining work | The original plan no longer reflects how the work will be done |
| Estimate to complete (ETC) | EAC − AC | How much more money is needed |
| Variance at completion (VAC) | BAC − EAC | The expected overrun or underrun at the end |
| To-complete performance index (TCPI) | (BAC − EV) ÷ (BAC − AC) | The CPI the remaining work must achieve to finish on budget |
TCPI is the reality check. If the project has run at a CPI of 0.88 and the TCPI says it now needs 1.15 to land on budget, the budget will almost certainly not be met without a change in scope, method or funding.
There is also evidence that cost performance rarely recovers by itself. Research by David Christensen on US defence contracts found that the cumulative CPI tends to settle early, roughly once a fifth of the work is done, and seldom improves much afterwards. Construction projects are not defence programmes, but the lesson carries: an early CPI below 1.0 is a signal to act, not to wait.
A worked example (illustrative figures)
The numbers in this section are invented and rounded to keep the arithmetic easy to follow. None of them comes from a YelloSKYE project.
A contractor is building the concrete frame of a four-storey building. The package budget (BAC) is 2,000,000 in the project currency, spread over 20 weeks. At the end of week 10, the project team reviews four control accounts.
| Control account | Budget | Planned % by week 10 | PV | Reported % | Site-verified % |
|---|---|---|---|---|---|
| Substructure | 400,000 | 100% | 400,000 | 100% | 100% |
| Columns and cores | 600,000 | 60% | 360,000 | 55% | 50% |
| Suspended slabs | 800,000 | 40% | 320,000 | 35% | 25% |
| Roof and stair cores | 200,000 | 0% | 0 | 0% | 0% |
| Package total | 2,000,000 | 1,080,000 |
Actual cost to date, including accrued but uninvoiced concrete and formwork hire, is 1,050,000.
The reported percentages give an EV of 1,010,000. The percentages checked against a site capture taken on the status date give an EV of 900,000. Here is how the two versions compare.
| Measure | Using reported progress | Using site-verified progress |
|---|---|---|
| Earned value (EV) | 1,010,000 | 900,000 |
| Schedule variance (SV) | −70,000 | −180,000 |
| Cost variance (CV) | −40,000 | −150,000 |
| SPI | 0.94 | 0.83 |
| CPI | 0.96 | 0.86 |
| EAC (BAC ÷ CPI) | about 2,079,000 | about 2,333,000 |
| EAC (cost and schedule method) | about 2,151,000 | 2,590,000 |
| Variance at completion (CPI method) | about −79,000 | about −333,000 |
| TCPI | 1.04 | 1.16 |
What the example shows
On the reported figures, the package is a little behind and about 4 per cent over budget. That is the kind of result a monthly meeting notes and moves past. On the verified figures, the package is a sixth behind its planned pace, is buying 86 worth of work for every 100 spent, and needs a CPI of 1.16 for the rest of the job to finish on budget.
The difference in earned value is 110,000, about 5.5 per cent of the package budget. Because the forecasts divide by the indices, that gap grows to more than 250,000 in the CPI-method forecast and more than 400,000 in the cost and schedule forecast. Small optimism in the input becomes a large error in the output, and it lands in the slab account, which carries the most budget.
Nobody in this example was dishonest. A slab that is formed and reinforced but not yet poured feels well advanced to the team building it. The earned value rules, though, credit what is complete, and that has to be measured.
Why earned value is the weak link
PV is fixed when the baseline is set. AC comes from invoices and timesheets, which are audited. EV is the only figure that depends on someone judging physical progress, and three habits make it unreliable.
Progress is credited by eye
When percent complete is a supervisor's estimate, partly finished work tends to be rounded up. The measuring methods, and the reasons they drift, are set out in our percent complete guide. The point for EVM is that every error there passes straight into EV, and from EV into every index and forecast.
The dates do not match
Actual cost is often taken at the month-end close while progress is gathered on a site walk a week earlier, or the other way round. EV and AC then describe different moments, and the CPI compares work at one date with spending at another. Both figures must share one status date.
Costs are missing from the ledger
Materials delivered but not invoiced, plant on hire and subcontract work done but not yet claimed all belong in AC. Leaving them out makes CPI look better than it is, which is just as misleading as an inflated EV.
Feeding EVM with site-verified progress
The fix for an unreliable EV is to give each control account's percentage something physical to be checked against, captured on the status date. This is where reality capture earns its place in project controls.
| Type of work | How EV is best measured | What a site capture checks |
|---|---|---|
| Earthworks and excavation | Measured volume against total volume | Cut and fill volumes calculated from successive drone surveys |
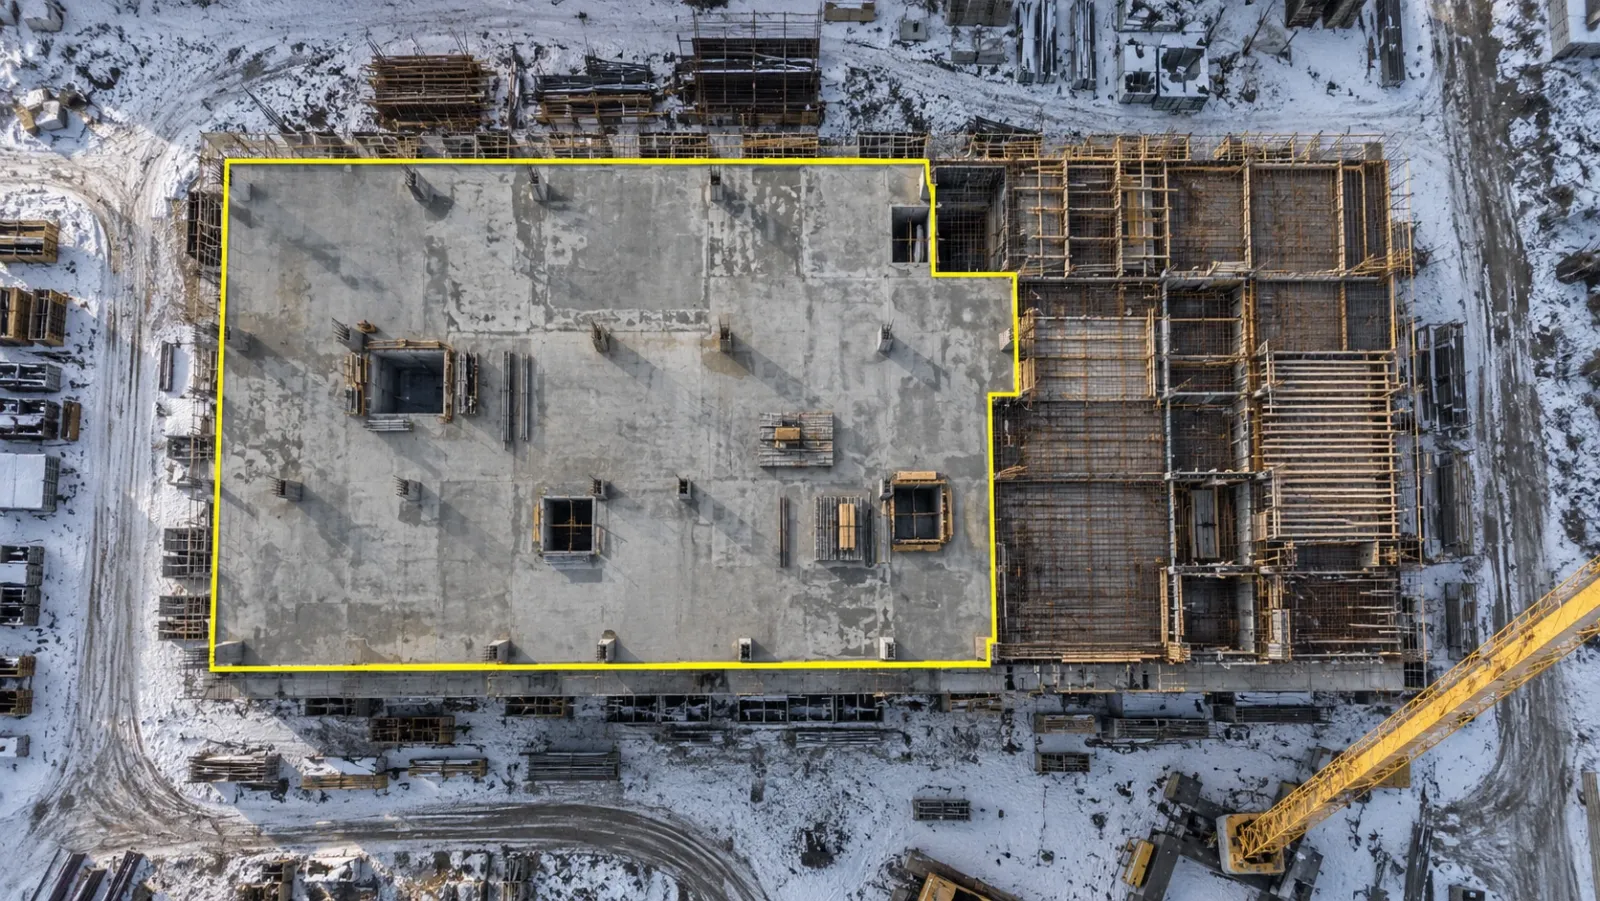
| Frame and structure | Completed units: slabs poured, columns cast | Top-down drone imagery and 3D models showing what is in place |
| External works and roads | Lengths or areas completed | Orthomosaics measured for length and area |
| Interior services and finishes | Credit for completed steps | 360° walkthroughs showing each step room by room |
| Critical zones with fast cycles | Start and finish of each activity | Fixed-camera imagery dated to the hour |
On Construct IQ projects, drones fly the same pre-planned routes on a regular cycle, and earthwork volumes measured from those flights agree with traditional survey methods to within 1 to 3 per cent. That lets a project control team use measured quantities as EV for earthworks, rather than a contractor's estimate. The earthwork volumetric analytics use case describes this approach settling arguments over how much material has moved.
For structure and fit-out, DEX compares each capture with the baseline programme in 4D and shows planned and actual progress curves, so a lagging zone stands out before anyone opens the cost report. Every capture stays on a dated timeline, which means the percentage behind any month's EV can be traced to what the site looked like that day.
Timing is the simplest gain. When flights are scheduled to fall on each billing cut-off, as in our contractor billing dispute use case, the progress input for EVM and the progress claimed for payment come from the same record. Project managers in that deployment cut the site visits they made for verification by 80 per cent.
Software does not replace the engineer in this loop. Automated processing flags where the site and plan differ; a person decides what counts as complete. Our comparison of AI and manual progress verification explains how to split that work.
From indices to forecasts you can defend
Once EV is checked, the forecasts become something the team can act on rather than argue about. Three habits help.
- Report the range, not one EAC. Show the CPI-method and cost-and-schedule forecasts side by side with the bottom-up estimate. If they disagree widely, find out why.
- Watch the trend. Plot SPI and CPI for each control account every period. A steady slide is more telling than any single reading.
- Go back to the record. When a control account goes red, open the captures for that zone and date before calling a meeting. In our aerial progress capture use case, reviews built around shared visual data took 30 minutes instead of two hours.
EVM is a recognised discipline with its own international standard, ISO 21508, and guidance from bodies such as the Project Management Institute. None of that rigour helps if the progress figure is wrong. The method assumes a measured input; site capture is how construction teams supply one.
Checklist: setting up EVM on your project
- Cost-load the baseline programme so planned value can be read for any date, and freeze it under change control.
- Group work into control accounts small enough to measure and large enough to matter, each with a named owner.
- Choose a progress method for each account before work starts, favouring measured quantities wherever possible.
- Fix one status date per period and make sure EV, AC and PV are all taken on it.
- Include accruals in actual cost for materials, plant and subcontract work not yet invoiced.
- Schedule a site capture on every status date so each account's percentage can be checked against the site.
- Review SPI, CPI and TCPI by account, and investigate any account that stays below agreed thresholds for two periods.
- Keep the captures with the EVM report, so every figure can be traced to what was built.
Frequently asked questions
What is earned value in construction?
Earned value is the budgeted cost of the work that has actually been completed by a given date. It is found by multiplying each activity's verified percent complete by that activity's budget and adding the results. It lets you compare what the work done was worth with what it was planned to be worth and what it actually cost.
What is the difference between SPI and CPI?
SPI, the schedule performance index, is earned value divided by planned value and shows how fast work is being done compared with the plan. CPI, the cost performance index, is earned value divided by actual cost and shows how much work each unit of money is buying. A value of 1.0 means on plan; below 1.0 means behind schedule or over budget.
How do you calculate estimate at completion (EAC)?
The most common formula is the budget at completion divided by the CPI, which assumes cost performance to date will continue. Other versions add the remaining budget to actual cost when a past overrun is not expected to repeat, or divide the remaining work by CPI multiplied by SPI when schedule pressure is likely to push costs up. Teams should also prepare a bottom-up estimate for comparison.
What is a good CPI on a construction project?
A CPI of 1.0 or above means the work done so far has cost no more than its budget. Many teams look closely at any control account below about 0.95 and treat anything below 0.90 as a serious warning. The trend over several periods matters more than one reading, and a CPI is only meaningful if the earned value behind it has been checked on site.
Can earned value management be used on small construction projects?
Yes, in a simpler form. Even a small project can set a time-phased budget, measure progress at each payment cut-off and compare it with cost. The calculations take minutes in a spreadsheet; the effort goes into agreeing how progress is measured and making sure it matches the site.