
Key takeaways
- The Question: How accurate is a drone map, what makes it more or less accurate, and how do you prove it is good enough for the job?
- The Answer: Accuracy comes from the whole chain: resolution, overlap, positioning, ground control, terrain, light and processing. It has two halves, relative and absolute, and height is usually the weaker axis. The only real proof is a comparison with independent check points, and the level worth paying for depends on the decisions the map will support.
- The YelloSKYE Angle: Survey IQ holds its surveys to ±2–3 cm in plan and height by using corrected drone positions and surveyed targets together, then stores each one on a shared reference in the DEX platform so dates can be compared.
Drone mapping accuracy is how closely positions, distances and heights measured on a drone map agree with the real ground. There is no single figure for it. An uncorrected consumer flight may be internally consistent but placed a metre or more away from its true coordinates; a controlled survey with corrected positioning can hold to a few centimetres. At YelloSKYE, Survey IQ gets to ±2–3 cm in both plan and height because every survey flight uses an RTK-GNSS drone and is tied to targets measured on the ground.
The useful question is not "how accurate is a drone?" but "how accurate does this map need to be, and how will we know it is?" This guide separates the two kinds of accuracy, walks through where map error comes from, explains how to read an accuracy statement, and sets out a tiered way to match accuracy to the project.
Two questions hiding inside "how accurate is it?"
People use "accuracy" to mean different things, and a supplier can honestly answer one while you are asking the other.
| Kind of accuracy | The question it answers | What spoils it | Work that depends on it |
|---|---|---|---|
| Relative (internal) | Is a 50 m line on the map really 50 m? Are shapes and areas right? | Poor overlap, weak image matching, lens distortion | Areas, lengths, single-date stockpiles, visual inspection |
| Absolute (positional) | Is each point where it should be on the project grid and height datum? | Uncorrected positioning, bad control, datum errors | Design overlays, cut and fill against design, setting out checks |
| Repeatability | Does this month's map line up with last month's? | Changing control, settings or coordinate system between flights | Progress comparison, earthwork payments, change detection |
Relative accuracy is easier to get. A well-flown map with good overlap will usually measure lengths and areas correctly even with no correction at all. Absolute accuracy needs the map tied to the ground, through RTK or PPK, ground control or both. Repeatability needs that tie to be identical every time.
Where drone map error comes from
Think of map error as a budget. Each stage of the work spends some of it, and the final figure can never be better than the weakest link.
| Factor | Mainly affects | Typical symptom | What to do |
|---|---|---|---|
| Ground sample distance | Both | Features too small to pick precisely; soft edges | Fly lower or use a better camera for fine work |
| Overlap and image geometry | Relative, height | Gaps, warped edges, a bowl or dome in the surface | Higher overlap; cross lines or oblique passes on steep sites |
| Drone positioning | Absolute | Whole map shifted or tilted | RTK or PPK on a known base |
| Ground control | Absolute, height | Offsets near the edges; heights drift across the site | Spread control across the site, high and low |
| Terrain and surface | Height | Holes over water or glass; false ground under trees | Plan for the surface; fill hidden areas on foot |
| Light, wind and camera | Relative | Blur, uneven tones, failed matching | Fly in steady light and moderate wind; fast shutter |
| Processing and datum | Absolute | Constant height offset; map in the wrong grid | Agree the coordinate system and geoid before processing |
Resolution
Ground sample distance (GSD), the ground size of one pixel, sets the floor. A target or edge can only be located to within a fraction of a pixel or so, so a coarse GSD limits how precisely anything can be placed. Fine resolution is not the same as accuracy, though, and our guide to ground sample distance explains why the two are often confused.
Overlap and geometry
Photogrammetry fixes each point by seeing it from several camera positions. Low overlap means fewer views and weaker geometry, especially near the edges of the flight and over plain surfaces. A purely parallel grid flown with one camera angle can also leave the lens model poorly defined, which shows up as a gentle curve in heights across the site.
Positioning and control
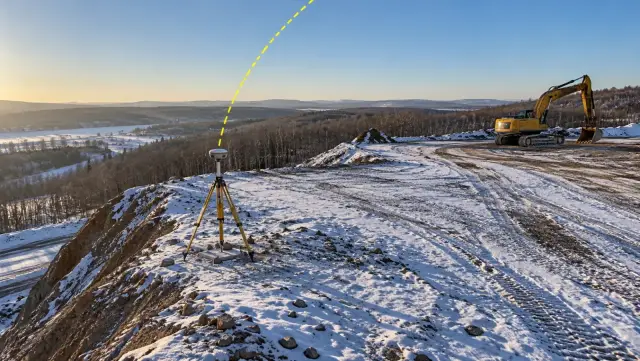
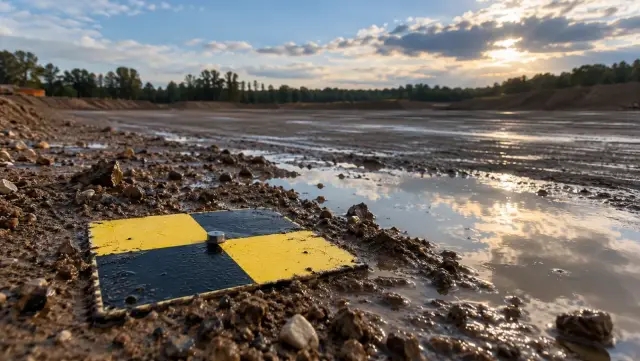
Uncorrected drone positions are good enough to make a map look right but not to place it. RTK or PPK fixes the camera positions; ground control fixes the model to the project's own coordinates and height datum. Our RTK vs PPK guide covers the positioning choice, and the ground control points guide covers layout.
Terrain, light and the camera
Dense vegetation hides the ground, water and glass give the software nothing stable to match, and moving plant leaves ghosting. Harsh contrast, passing cloud and strong wind all reduce the quality of the images. Cameras that read the sensor line by line can distort features when the drone is moving quickly, so mapping crews either slow down or use a camera with a global or mechanical shutter.
Horizontal and vertical are different numbers
Height is almost always the weaker axis. Satellite positioning is less certain vertically, and photogrammetry derives height from the angles between overlapping photos, which is less robust than position in plan. Expect the vertical figure to be larger, and ask for it separately.
This matters most where money depends on heights. Consider a 5 hectare earthworks platform, 50,000 square metres. A consistent vertical bias of just 2 cm across it changes the calculated volume by 1,000 cubic metres, without a single shovel moving. On a project that pays for earthworks by the cubic metre, that is the difference between agreement and dispute. It is also why surveys used for payment are flown on the same control every time.
How to read an accuracy statement
A trustworthy drone survey comes with a short accuracy statement. These are the lines that matter.
| Line in the statement | What it means | Warning sign |
|---|---|---|
| Points used | Which targets fixed the model (control) and which tested it (check) | No check points, or check points that were also used as control |
| RMSE per axis | Typical error in easting, northing and height at the check points | Only a combined figure, or only horizontal |
| Mean error per axis | Average signed error, revealing any systematic bias | A mean close to the RMSE, meaning most of the error is one consistent shift |
| Largest error | The worst check point | One point far worse than the rest, unexplained |
| Check point locations | Where on the site the test was done | All points on flat ground near the gate |
| Coordinate reference | Which map grid and vertical datum the figures are in | Not the reference the designers work in |
| How check points were measured | Instrument and method | A method no more precise than the map itself |
RMSE, bias and spread
RMSE is the headline figure, but read it with the mean error. If the mean height error is close to the RMSE, most of the error is a single offset, which often points to a datum or base station problem and can usually be fixed. If the mean is near zero and the RMSE is still high, the error is scattered noise, which points to the flight or the processing.
Check points, not control points
Residuals on control points describe the fit to targets the software already used, so they look good almost by definition. Check points were never seen during processing, which is what makes them an honest test. Formal standards, the ASPRS positional accuracy standard among them, judge a dataset on independent points for this reason, and some also convert RMSE into a 95 per cent confidence figure. Whichever standard your contract names, apply its method the same way every time. For the rest of the quality report, from image calibration to overlap, see the guide to drone image processing.
Spread across the site
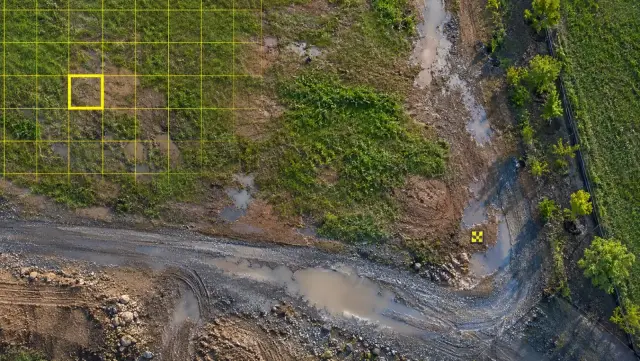
A check point only tests the ground around it. Points on the high and low areas, in the interior and near the edges tell you far more than the same number grouped on a level car park.
Running your own spot check
Even without commissioning a formal test, a project team can sense-check a map in an afternoon:
- Pick hard, well-defined features spread across the site: manhole covers, kerb corners, painted marks, the corners of slabs.
- Measure them independently with a GNSS rover or total station on the project's control.
- Read the same points from the map at the same locations, in plan and height.
- Compare and look for patterns. A consistent offset suggests a datum or base issue; scattered differences suggest flight or processing problems; errors that grow towards one side suggest weak control there.
A tiered approach to accuracy
Accuracy costs time on site and in the office, so it pays to match the effort to the decision. A useful way to plan is in tiers, starting where most programmes begin and stepping up only where the work demands it.
| Tier | Decisions it supports | Positioning | Ground control | Proof to ask for |
|---|---|---|---|---|
| 1. Visual record | Site overview, stakeholder updates, marketing | Standard drone GNSS | None | Coverage and image quality |
| 2. Measured, relative | Areas, lengths, single-date stockpile estimates | Standard GNSS or RTK | Optional | A known distance measured on the map |
| 3. Positioned | Overlays of site plans and logistics, progress comparison | RTK or PPK on a known base | A few points | Check points, horizontal and vertical |
| 4. Design and payment grade | Cut and fill against design, grading, drainage, earthwork billing | RTK or PPK | Spread across site, high and low | Full check point statement on the project datum |
| Beyond drone mapping | Legal boundaries, structural setting out, tight-tolerance levels | Ground instruments | Survey control network | Licensed surveyor's certified survey |
Starting out
Tier 1 and Tier 2 work is where most teams learn to fly consistent maps. The main discipline is a fixed flight plan and steady conditions, so maps look and measure the same each time.
Moving up
Tier 3 adds a corrected position and a handful of check points. This is enough to lay a site plan on the map with confidence and to compare dates.
Design and payment
Tier 4 is where drone mapping replaces conventional topographic and quantity surveys, and where every element of the error budget needs attention. The drone topographic survey guide covers how to scope that work so the deliverables match the design team's needs.
Keeping accuracy consistent between flights
For change detection and payment, repeatability matters as much as any single figure. Keep the same control marks, the same coordinate system, the same flight height and overlap, and the same processing settings from flight to flight. In YelloSKYE's earthwork volumetric analytics work, client and contractor settled monthly claims from the same cut-and-fill figures, checked by DEX against the grading design, with zero billing disputes and a survey cycle measured in hours rather than two weeks. Agreement of that kind depends on consecutive surveys sharing one reference.
How YelloSKYE handles accuracy
Every Survey IQ flight combines RTK-GNSS positioning on the aircraft with surveyed control on the ground. The result, ±2–3 cm in plan and height, is fit for feasibility studies, cut and fill analysis and design work. Formal boundary demarcation remains a job for a licensed surveyor in most regions.
Accuracy is then put to work in the DEX platform. In terrain-based design validation, the CAD layout is aligned to the drone terrain model so level mismatches and encroachments surface at the planning stage, giving 100% terrain verification before design lock-in. In flood risk and drainage planning, water flow simulation runs on the same terrain model, where small errors in height would move the predicted low points. Because each new survey joins the earlier ones on a single timeline, a difference between dates can be read as real change on site.
Accuracy checklist
- Write down the decisions the map will support, then choose the tier.
- Ask which accuracy is being quoted: relative, absolute, horizontal or vertical.
- Agree the coordinate system and height datum before anything is measured.
- Choose resolution, overlap and positioning to suit the tier, not the other way round.
- Spread control and check points across the whole site, including high and low ground.
- Request RMSE and mean error per axis at check points, plus the worst point.
- Treat a large mean error as a clue to a datum or base problem.
- Keep control, settings and coordinate system fixed between repeat flights.