
Key takeaways
- The Question: Which sustainable construction practices can a project team actually measure on site, and what records will stand up when the figures are reported or audited?
- The Answer: Pick a small set of metrics for waste, materials, fuel and energy, water and dust, set a baseline early and collect the data monthly from tickets, meters and logs. Back each figure with dated site evidence, so sustainability reports and certification claims rest on records rather than estimates.
- The YelloSKYE Angle: Using drones, fixed cameras and 360° walks, Construct IQ builds a dated visual record of the site, and drone surveys measure stockpile and earthwork volumes. That record does not replace meters or waste tickets; it checks and supports them.
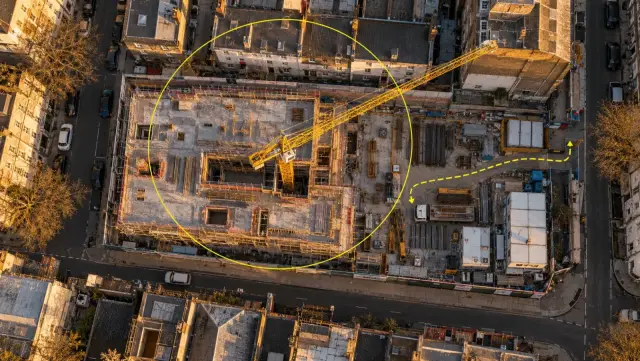
Sustainable construction practices are the methods a project uses to reduce the environmental cost of building: less waste and more reuse, careful use of materials, less fuel and energy, lower emissions, and tight control of water, runoff and dust. The ones that work on site share one feature: someone measures them every month, against a baseline, with evidence anyone can check. YelloSKYE's part in this is the site record. Construct IQ, our construction monitoring service, captures the site on a regular cycle so the practices written into plans can be seen and checked in the field.
This guide goes through each area in turn, with the metric to track, where the data comes from and what to keep as evidence, then covers how those records support sustainability reporting and green building certification.
Why the site phase deserves its own numbers
Most of a building's lifetime carbon comes from making its materials and running it once complete, not from the construction site itself. But the site is where design intentions meet reality, and where several large impacts are decided: how much material is wasted, what happens to excavated soil, how much diesel is burned and whether pollution reaches neighbours and watercourses.
The scale is significant. The UN Environment Programme's Global Status Report for Buildings and Construction attributes around 37 per cent of global energy and process-related carbon dioxide emissions to the buildings and construction sector. In the European Union, the European Commission reports that construction and demolition waste makes up more than a third of all waste generated. The US Environmental Protection Agency estimated that around 600 million tons of construction and demolition debris were generated in the United States in 2018.
Site figures also matter commercially. Owners increasingly ask contractors for project-level data to feed their own carbon reporting, and certification schemes award credits for evidence collected during construction. A project that cannot produce the numbers loses both.
Set a baseline and a short list of metrics
Trying to measure everything leads to measuring nothing well. Choose a handful of metrics, agree the data source for each before work starts and report them on the same cycle as progress.
| Area | Metric | Typical unit | Data source | Site evidence |
|---|---|---|---|---|
| Waste | Waste per unit of floor area; share diverted from landfill | t per 100 m²; per cent | Carrier tickets, transfer notes | Photos and aerial views of segregation areas |
| Materials | Excavated material reused on site; reclaimed material used | m³; t or per cent of value | Survey volumes, delivery records | Repeated stockpile and earthwork surveys |
| Fuel | Diesel used by plant and generators | litres per month | Fuel logs, supplier invoices | Plant on site by date, generator positions |
| Electricity | Site energy from grid and generators | kWh per month | Meter readings | Date of grid connection, cabin layout |
| Water | Mains and abstracted water used; water reused | m³ per month | Water meters | Wheel wash and recycling set-up |
| Dust and runoff | Exceedances or complaints; control measures in place | count | Monitors, complaints log | Dated views of suppression, covers, silt controls |
Set the baseline from the first month of full activity, or from a comparable completed project, and agree whether figures are normalised by floor area, project value or programme week. Comparisons only work if every project uses the same basis.
Waste: prevent it first, then measure what leaves
The waste hierarchy, written into law in many places such as the EU Waste Framework Directive, ranks options in order: prevent, prepare for reuse, recycle, recover and, last, dispose. On site, the first rung delivers the most and is measured least.
Prevention
- Order to quantity, not to habit. Over-ordering and broken pack sizes are a large source of clean, wasted material. Compare quantities delivered with quantities installed for the main materials each month.
- Protect what is stored. Materials ruined by weather or damaged by plant become waste without ever being used. The laydown arrangements in a good site logistics plan are a sustainability measure as much as a logistics one.
- Avoid rework. Work torn out and rebuilt doubles the materials, transport and energy for the same result. The prevention steps set out in reducing rework cut waste as directly as any recycling scheme.
Segregation and measurement
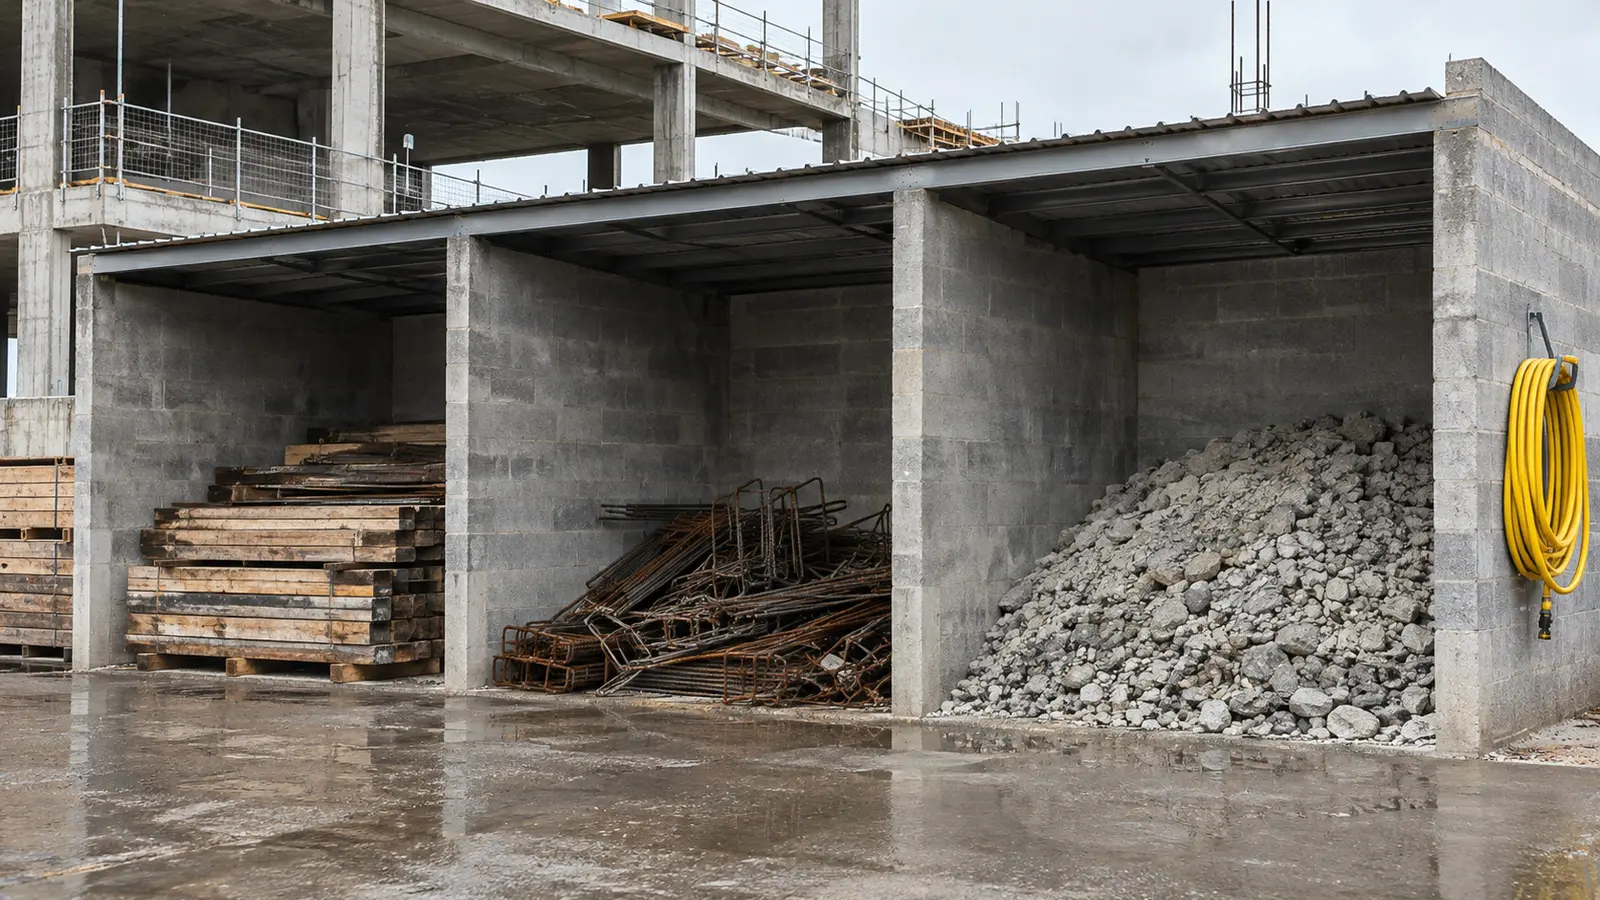
Separate streams at source: timber, metals, inert material, plasterboard, packaging and mixed waste are the usual minimum. Record the weight and destination of every load from the carrier's paperwork, not from skip counts. Then check segregation is really happening. A fixed camera overlooking the waste area, or the waste area included in each drone flight, gives a dated view of whether skips are contaminated or overflowing, and a record auditors can trust.
Materials and reuse
Materials carry most of a building's embodied carbon, so the biggest decisions are made in design and procurement. Site teams still control three things.
Reusing excavated material
Moving soil off site and importing fill burns fuel twice and can fill landfill with clean material. Balancing cut and fill on site, and stockpiling topsoil for reuse in landscaping, avoids both. It depends on knowing the volumes. Repeated drone surveys calculate cut, fill and stockpile volumes from measured surfaces, and our earthwork volumetrics use case shows Survey IQ replacing slow manual surveys with drone-based cut-and-fill analysis. How stockpile volumes are calculated and reconciled is explained in our guide to stockpile volume measurement.
Using reclaimed and lower-carbon products
Reclaimed steel, timber, bricks and crushed concrete aggregate can replace new products where specifications allow. Record what was used, its quantity and its source. For new products, ask suppliers for environmental product declarations so the embodied carbon of what was actually installed can be calculated, not just what was specified.
Checking what was installed
Substitutions happen on every project. Dated progress captures, tied to locations, show which product went where and when, so the as-built material record can be checked against delivery notes.
Fuel and energy
On most sites, diesel is the largest direct source of emissions, burned in excavators, cranes, telehandlers and generators.
- Connect to the grid early. A permanent or temporary grid connection in the first weeks usually removes the largest generators from site. Track the date it happens; a delayed connection is often the biggest single fuel cost.
- Size and switch off generators. Oversized sets running at low load waste fuel. Hybrid units with batteries let the engine stop at night and during light loads, running the site from stored power.
- Cut idling. Plant left running between tasks burns fuel for nothing. Telematics, where plant has it, reports idle hours directly.
- Consider electric and hybrid plant for compact equipment, especially in enclosed or urban areas.
- Reduce travel. Repeated visits by managers, consultants and owners add up. Remote review of a reliable site record replaces some of them, and in YelloSKYE's fixed-camera monitoring deployments, site visits fell by as much as 80 per cent.
Record fuel by month from logs and invoices, and electricity from meter readings, starting on day one. A month missed at the start cannot be rebuilt later.
Turning activity into emissions
Fuel, electricity, materials, transport and waste data become a carbon figure by multiplying each quantity by an emission factor. Use factors published by a recognised source for your country, such as the conversion factors issued by the UK government or the US EPA's emission factors, and state which set and year you used.
The Greenhouse Gas Protocol groups the results into three scopes, and owners usually ask for them in that form:
| Scope | What it covers on a construction project | Typical data |
|---|---|---|
| Scope 1 | Fuel burned in the contractor's own plant and generators | Fuel logs |
| Scope 2 | Purchased electricity used on site | Meter readings, supplier invoices |
| Scope 3 | Materials, deliveries, waste, subcontractor plant, staff travel | Delivery records, product declarations, waste tickets, travel logs |
Scope 3 is usually the largest and the hardest to collect. Asking subcontractors for fuel and delivery data as a condition of the subcontract is far easier than chasing it at the end.
Water, runoff and dust
These are the impacts neighbours notice first, and the ones regulators most often act on. Rules and limits differ by country and by local authority; in the UK, for example, the Institute of Air Quality Management publishes guidance on assessing dust from construction.
Water
Meter mains water and any abstraction, and record water reused from wheel washes, settlement tanks or rainwater collection. Check meters monthly; a leaking temporary supply can run for weeks unnoticed.
Runoff and sediment
Exposed soil, stockpiles and haul roads wash silt into drains and watercourses during heavy rain. Silt fences, settlement ponds, covered stockpiles and stabilised entrances prevent it. Aerial maps flown on a regular cycle show where ground is exposed, whether controls are in the right place and how drainage paths change as earthworks progress. Our guide to environmental monitoring with drones covers erosion and sediment checks in more depth.
Dust
Dust suppression, covered loads, wheel washing and limits on dry cutting are standard controls. Where monitoring is required, keep the monitor readings and the complaints log together with dated views of the controls in place, so any exceedance can be compared with the activity and controls visible that day.
Site records that support reporting and certification
Sustainability claims are increasingly audited, whether by certification assessors, owners' advisers or lenders. Green building schemes such as LEED, BREEAM, Green Star and DGNB each award credits linked to the construction stage, typically for managing and recording waste, monitoring site energy and water, preventing pollution and documenting materials. Requirements differ by scheme and version, so read the current manual for the scheme on your project.
Whatever the scheme, good evidence has the same qualities.
| Claim | Primary evidence | Supporting site record |
|---|---|---|
| Waste diverted from landfill | Carrier tickets with weights and destinations | Dated views of segregated waste areas through the project |
| Excavated material reused on site | Survey volumes before and after | Repeated drone surveys of cut, fill and stockpiles |
| Site energy and water monitored | Monthly meter readings | Dated record of meter locations and grid connection |
| Pollution controls maintained | Inspection checklists, monitoring data | Aerial and fixed-camera views of silt controls and dust suppression |
| Protected trees and habitats kept clear | Ecologist sign-offs | Drone maps showing fences and exclusion zones on each date |
| Specified products installed | Delivery notes, product declarations | Dated, located progress captures |
A visual record does not prove a weight or a kilowatt-hour. It proves that the conditions behind the numbers existed when the report says they did. On YelloSKYE's DEX platform, drone maps, 360° walks and fixed-camera images are held together by date, Time Travel Playback returns the view to any earlier capture, and geo-referenced annotations pin observations, such as a contaminated skip or a damaged silt fence, to the place they were seen. The aerial progress capture example shows the regular site-wide flights that make that kind of review possible without a site visit.
A monthly sustainability routine for the site team
- Collect waste tickets, fuel logs, meter readings and delivery records for the month, and enter them against the agreed metrics.
- Compare each metric with the baseline and the previous month, and note the reason for any large change.
- Review the latest drone map and fixed-camera views of waste areas, stockpiles, silt controls and protected zones.
- Log any failure of a control with its location, owner and date fixed.
- Update stockpile and earthwork volumes, and check planned reuse of excavated material is on track.
- Ask subcontractors for their fuel and delivery data before the month closes.
- File the month's figures with their evidence in one place, ready for the owner's report or the certification assessor.