Oil and Gas Drone Inspection: Pipelines, Tanks, Flares and Methane
By Kush Agarwal, President and CEO, YelloSKYE. Published .
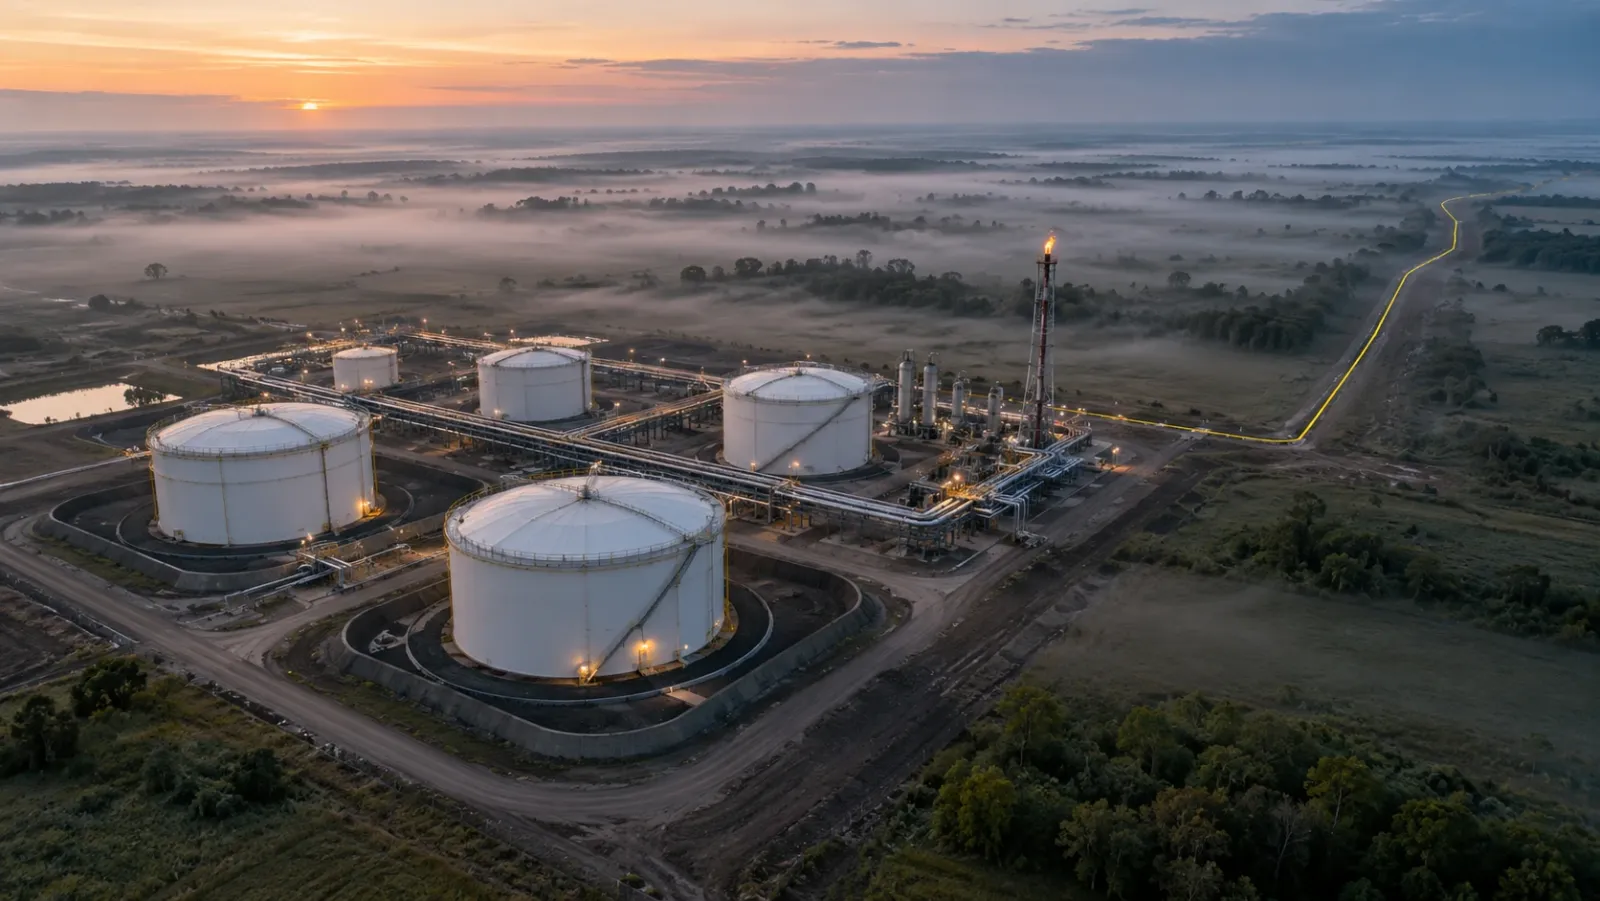
Executive Summary
- The Question: Which oil and gas assets can a drone inspect, what does each flight find, and how far can drones go with leak and methane detection?
- The Answer: Drones survey pipeline corridors, tank farms, flare stacks, process plant and well sites without shutdowns or work at height, using visible, thermal and LiDAR sensors. Gas detection needs a dedicated payload. The value comes from a dated, located record that feeds integrity work and emissions reporting.
- The YelloSKYE Angle: Inspect IQ scans stacks, industrial structures and linear assets with RGB, radiometric thermal and LiDAR, and every defect is logged with its position, severity and recommended fix in the DEX platform.
Oil and gas drone inspection uses aircraft carrying visible, thermal, LiDAR or gas-sensing payloads to check the condition of production, transport and storage assets: pipelines and their rights of way, storage tanks and bunds, flare stacks, process structures and well sites. It replaces much of the climbing, scaffolding and helicopter flying these checks used to need, and it leaves a repeatable record of every asset. YelloSKYE handles this work through Inspect IQ, our asset inspection solution.
The sector has more asset types than most, and each one needs a different flight, sensor and set of questions. This guide goes through them in turn, then covers leak and methane detection, what drone records add to emissions reporting, how to fly safely on a hydrocarbon site, and which inspections a drone cannot replace. Electrical networks are covered separately in our power line drone inspection guide.
Why operators bring drones onto oil and gas sites
Three pressures push operators towards aerial inspection.
- Exposure. Checking a flare tip, a tank roof or a tall column by hand means rope access, scaffolding, man baskets or entry onto floating roofs, often near hydrocarbons. A drone collects the first look from the ground.
- Distance. Pipelines run for hundreds of kilometres and well sites are scattered across remote country. Ground patrols are slow and helicopter flights are costly; drones cover the same ground at lower cost and closer range.
- Uptime. Many checks that once needed a shutdown can be done from a safe stand-off while the plant keeps running, so findings arrive before the next turnaround instead of during it.
On YelloSKYE's asset inspection page, the gain is described as 90 per cent less scaffolding and checks completed five times faster.
What a drone checks, asset by asset
| Asset | What the drone looks for | Main sensors | What it reduces |
|---|---|---|---|
| Pipeline right of way | Encroachment, excavation, erosion, exposed pipe, vegetation, signs of leaks | RGB mapping, multispectral, LiDAR | Foot and vehicle patrols, helicopter flights |
| Storage tanks | Roof condition, seals, standing water, shell coating, corrosion, settlement | RGB close-ups, thermal, survey models | Roof access and external scaffolding |
| Bunds and containment | Cracks, vegetation, blocked drains, standing liquid | RGB mapping | Walk-round inspections |
| Flare stacks and vents | Tip and burner condition, pilots, structure, guy wires, platforms | Zoom RGB, thermal | Shutdowns and climbing |
| Process plant and pipe racks | Damaged cladding, wet insulation, corroded supports, leaks at flanges | RGB, thermal, LiDAR | Scaffolding and rope access |
| Well sites | Layout, spills, housekeeping, containment, reclamation | RGB mapping | Site visits by road |
Pipelines and rights of way
For a buried line, the most common threats are on the surface: a contractor digging without notice, a new building creeping into the easement, a landslip, a river eating into a crossing. Corridor mapping flies along the route and produces a continuous orthomosaic and elevation model, so each flight can be compared with the last and with the agreed boundary. Survey teams look for fresh earthworks, washouts, exposed or unsupported pipe, missing marker posts and vegetation that blocks access or sightlines.
Leaks from buried lines often show first in the plants above them. Discoloured or dying vegetation, stained soil and unexplained wet ground along the route are reasons to send a crew, and multispectral vegetation indices can highlight stress before it is obvious to the eye. YelloSKYE's linear corridor mapping work, which covers pipelines alongside highways and railways, describes terrain-following flights that bind every pixel to global coordinates and survey data arriving five times faster than before. Planning these long, narrow flights is the subject of our drone corridor mapping guide.
Tank farms
A storage tank is inspected from three directions. From above, the drone records the roof: on floating roofs, pontoon covers, the rim seal, roof drains and any pooled water or product; on fixed roofs, coating, corrosion and vent fittings. From the side, it records the shell coating, nozzles, stairways, wind girders and insulation cladding. From a mapping height, it surveys the bund walls, the ground around the tank and the levels that reveal settlement.
Thermal imaging adds a useful check on tanks: the boundary between liquid and vapour space, or a layer of sludge at the bottom, often shows as a temperature line on the shell. Tank inspection codes such as API 653 set out what an external inspection must cover; drone imagery supports that external work and narrows down where close inspection is needed. It does not measure shell thickness.
Flare stacks and vents
Flares are tall, hot and usually live. A drone with a zoom camera can record the tip, burner nozzles, pilot assemblies, ignition lines, platforms, ladders and guy wires from a safe stand-off while the flare operates, and thermal imaging shows how heat is spread across the tip and the structure. That lets maintenance planners decide what parts and access to book for the next shutdown, instead of discovering the scope once the scaffolding is up. Stand-off distance should account for heat, turbulence and the risk of an unplanned release.
Process plant, stacks and pipe racks
Across process areas, drones photograph steelwork, pipe supports, cladding and structures that are hard to reach. Damaged or poorly sealed insulation cladding lets water in, and wet insulation is a classic setting for corrosion under insulation; thermal imaging can show where insulation is soaked or missing. On tall structures, Inspect IQ scans stacks from a safe distance for heat anomalies, spalled concrete and corroded surfaces, with no scaffolding erected. YelloSKYE's automated asset inspection use case describes RGB, thermal and LiDAR flown together on industrial plant and processed into a 3D digital twin, with every finding tied to GPS coordinates.
Well sites
Scattered well sites are a good fit for scheduled mapping flights. A current map shows whether equipment is where it should be, whether containment is intact, whether there are spills or stains, and how reclamation is progressing on abandoned sites. Reviewing that map from an office avoids many long drives just to confirm that nothing has changed.
Leak and methane detection
Finding gas is a different job from finding damage, and it needs a different sensor. Standard long-wave thermal cameras measure surface temperature and do not see methane.
| Method | What it gives | Limits |
|---|---|---|
| Optical gas imaging (OGI) camera | A video image of a hydrocarbon plume, showing the source | Visual result; quantifying the leak rate needs extra analysis |
| Laser absorption sensor | Methane concentration along the laser path, mapped over the site | Needs low, careful flight and wind data to estimate a rate |
| Point gas sensor | Concentration in the air the drone flies through, usually downwind | Depends heavily on wind and flight pattern |
| Visible and multispectral imagery | Indirect signs: vegetation stress, staining, ice on fittings | Not a gas measurement |
OGI cameras work in a narrow infrared band, around 3.3 micrometres, where methane and other hydrocarbons absorb strongly, which is what makes an invisible plume appear on screen. Laser and point sensors give numbers rather than pictures, and with wind data and a dispersion model they can estimate how much gas a site is releasing. Each method has a detection threshold that depends on wind, distance and flight pattern, so ask for evidence of how a system performed in controlled release tests.
The case for looking is strong. The International Energy Agency attributes around 30 per cent of the rise in global temperatures since the Industrial Revolution to methane, and its Global Methane Tracker estimates that around 40 per cent of methane emissions from fossil fuel operations could be avoided at no net cost, partly because captured gas can be sold. Over a 20-year period, the IPCC's Sixth Assessment Report puts methane's warming effect at more than 80 times that of the same mass of carbon dioxide.
For liquids, the signs are usually indirect: stressed vegetation, staining, sheen on water and ground that stays wet. Thermal contrast can help where the product is warmer or cooler than the soil around it.
Emissions reporting and compliance records
Methane and integrity rules differ by country and region, and they are changing. The US Environmental Protection Agency's methane rules and the European Union's methane regulation are two examples that require operators to find, repair and report leaks on a set schedule. The voluntary Oil and Gas Methane Partnership 2.0 framework, run by the UN Environment Programme, pushes companies towards reporting based on measurement rather than emission factors. Check what applies to each asset before designing a survey programme.
Whatever the rule, auditors want the same things: when a survey happened, what it covered, what it found, when each finding was fixed, and proof that the fix worked.
| Reporting need | What drone records provide | What they do not provide |
|---|---|---|
| Proof of survey | Dated, located flight logs and maps | Evidence of coverage at component level, unless flown that way |
| Findings | Located images or gas readings, with severity | A leak rate, unless a quantifying sensor and method were used |
| Repair verification | A repeat survey of the same spot after repair | The repair record itself, which lives in the maintenance system |
| Trend over time | Comparable surveys across months and years | Consistency, if flight plans and sensors change between surveys |
Inside the DEX platform, each defect sits at its location on the captured asset, dashboards show open findings and their severity, and the comparison view lets reviewers move between survey dates. Inspect IQ delivers its findings as a defect database in which every entry has a marked-up image, its coordinates, a severity grade and a suggested remedy. The database leaves the platform as PDF, Excel or BIM-linked files.
Flying safely on a hydrocarbon site
The drone removes people from height and from live equipment, but the flight brings its own risks.
Ignition and hazardous areas
Most drones are not certified for use in classified hazardous areas. Operators usually keep them outside zoned areas, or allow entry only under a permit with continuous gas monitoring. The flight should be part of the site's permit-to-work system, with a briefing, an agreed route, emergency procedures and a named person in the control room.
Heat, turbulence and releases
Flares, vents and hot exhausts create rising heat and turbulent air that can push a drone off course or damage it. Set stand-off distances with the operations team and abort if the flare load changes.
Aviation permissions
Long pipeline surveys often run beyond the pilot's line of sight, and many sites sit near airfields or restricted airspace. Rules differ by country, so raise the survey early with the relevant national aviation authority, such as the US FAA, the UK CAA or the UAE's GCAA. Docked drones that stay on site for routine flights are covered in our guide to drone-in-a-box systems.
What drones do not replace
- In-line inspection. Internal corrosion and wall loss in pipelines are measured by pigging tools, not from the air.
- Thickness and weld testing. Ultrasonic and other non-destructive tests still need a technician at the surface.
- Internal tank inspections. Floors and internal coatings are inspected with the tank out of service.
- Cathodic protection surveys. Pipe-to-soil readings are taken on the ground.
- Component-level leak surveys. Handheld detectors still find the smallest leaks at valves and flanges.
The drone survey sets the priorities for this work, so crews and budgets go to the assets with the clearest evidence of a problem.
Oil and gas drone programme checklist
- List every asset type and decide which question each flight must answer: damage, encroachment, gas or progress.
- Match the sensor to the question, and do not expect a thermal camera to find methane.
- Ask gas-detection providers for detection limits and controlled release test results.
- Bring flights into the permit-to-work system, with hazardous zones, stand-off distances and abort rules agreed.
- Confirm aviation permissions for corridor flights well ahead of the survey.
- Tag every finding to the operator's own references: line and chainage, tank number, flare or unit.
- Keep flight plans and sensors the same between surveys so trends are real.
- Re-fly repaired locations and keep the before and after records together for audit.
Frequently asked questions
Can a drone detect a methane leak?
Only with a gas-sensing payload. Optical gas imaging cameras make hydrocarbon plumes visible, laser absorption sensors measure methane along the beam, and point sensors sample the air the drone flies through. An ordinary thermal camera does not see methane, so ask any provider exactly which sensor they fly and how its detection limit was verified.
Do drones replace pipeline pigging or tank internal inspections?
No. A drone inspects what is visible from outside: the right of way, coatings, roofs, bunds, supports and structures. Wall thickness, internal corrosion and weld condition still need in-line inspection tools, ultrasonic testing or an internal tank inspection. The drone survey decides where those more expensive methods are needed first.
Is it safe to fly a drone over a live oil and gas facility?
It can be, under the site's permit-to-work system. A drone is an electrical device, so most operators treat it as a possible ignition source, keep it out of classified hazardous zones or require gas testing first, and set stand-off distances from flares and vents. Aviation permissions are separate and depend on the country.
How often should pipelines be surveyed by drone?
The interval depends on the operator's integrity programme, local rules and the risk along each section. Busy corridors with frequent third-party activity, river crossings and unstable slopes justify more frequent flights than remote, stable sections. Fly again after floods, landslides or reports of excavation near the line.
Can drone data support emissions reporting?
Yes, as dated and located evidence of surveys, findings and repairs. Measurement-based methane reporting needs a validated gas sensor and a recognised quantification method, so visual and thermal records support the report rather than provide the numbers on their own.