Solar Farm Drone Inspection: From Construction Checks to O&M Repairs
By Kush Agarwal, President and CEO, YelloSKYE. Published .
Executive Summary
- The Question: How should a solar farm use drones, from the day ground is broken to the tenth year of operation, and how do the findings turn into repairs?
- The Answer: During the build, drone surveys check grading, piling, racking and installation progress against the design. At commissioning they set a thermal and visual baseline. In operation, thermal flights in strong, steady sunshine find faulty modules, strings and connections, and each finding is ranked by safety risk and lost energy before crews are sent.
- The YelloSKYE Angle: Inspect IQ captures radiometric thermal and RGB imagery over live arrays, picks out hot spots, diode failures and string disconnections automatically, and pins every one to a GPS position in the DEX platform.
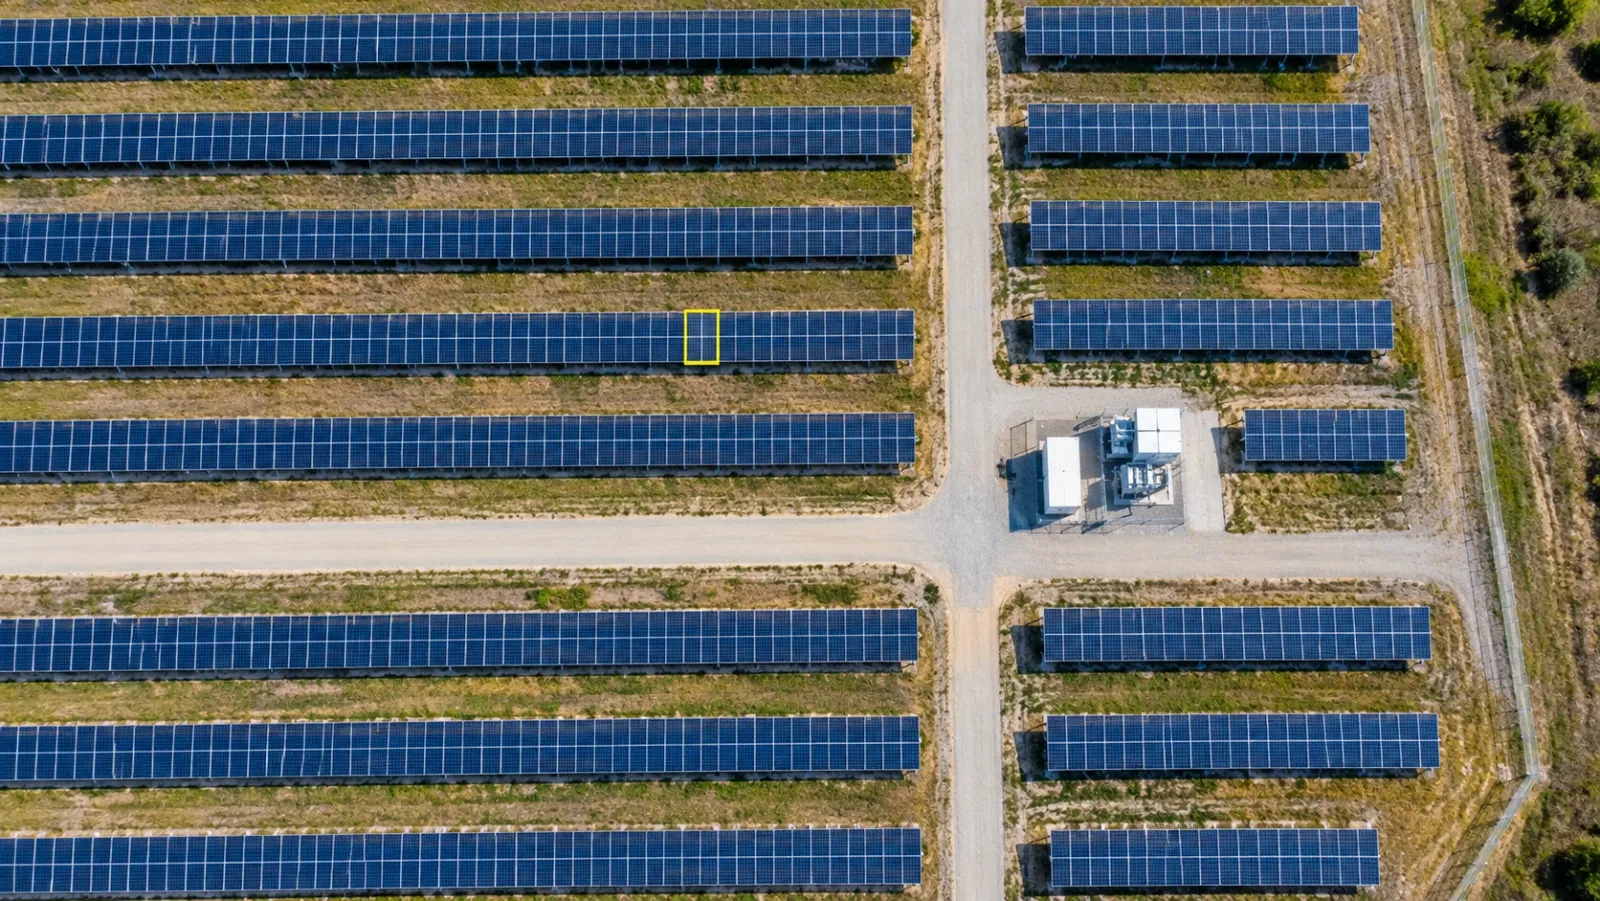
A solar farm drone inspection is a set of aerial surveys that record the condition of a photovoltaic plant, usually with a thermal camera and a high-resolution visible camera flown together. In operation, the thermal layer finds the modules, strings and connections that are losing energy or running dangerously hot; during construction, the visible layer and the survey models check that the plant is being built as designed. At YelloSKYE, solar plants are one of the core asset types covered by Inspect IQ, our asset inspection solution.
The sections that follow trace a plant through its life: what to check while it is being built, why the commissioning flight matters, which faults an O&M survey looks for, the conditions a valid survey needs, and how to rank findings so that repair crews spend their days on the right modules. The physics of thermography, and how to read individual heat patterns, are covered in our separate guide to drone thermal inspection.
A drone's job changes with the plant's stage
The same aircraft can serve the developer, the EPC contractor and the O&M team, but each asks a different question of it.
| Stage | Main question | Typical drone output | Who uses it |
|---|---|---|---|
| Site development | Is the land suitable, and what will grading cost? | Orthomosaic, terrain model, drainage paths | Developer, design engineer |
| Construction | Is the plant being built where and as drawn, and how far along is it? | Survey models, installation counts by block, as-built map | EPC contractor, owner's engineer |
| Commissioning | What does a healthy plant look like on day one? | Thermal and RGB baseline, module position register | Owner, O&M contractor |
| Operation | Where is energy being lost, and what is unsafe? | Anomaly list with locations, severity and causes | O&M team, asset manager |
| Claims and repowering | What changed, when, and who pays? | Dated comparisons between surveys | Asset manager, insurer, manufacturer |
Construction-phase checks
Errors made while a solar plant is being built are cheap to fix in the week they happen and expensive once thousands of modules sit on top of them. Large sites are also hard to see as a whole from the ground; a drone map shows every block on one screen.
Grading and drainage
Most ground-mounted plants need some earthworks so that trackers and fixed tables sit within their slope limits and rainwater runs off without scouring the rows. A drone terrain model compared with the grading design shows where cut and fill are still outstanding. In YelloSKYE's earthwork volumetric analytics work, the DEX platform calculates cut-and-fill volumes against the design grading plan, and the wait between flight and usable survey result fell from two weeks to a matter of hours. The same model shows ponding and erosion channels that will undermine piles if they are left alone.
Piling and racking layout
Piles driven in the wrong place, at the wrong height or not at all are easy to miss at ground level across hundreds of rows. An orthomosaic overlaid on the layout drawing exposes missing piles, rows that drift off line and blocks that stray past the boundary. Catching this before racking is fitted avoids pulling steel out later.
Installation progress
Counting installed tables, modules and inverters by block from a fresh map gives the owner's engineer an independent figure to check against a contractor's progress claim. Flying on a fixed cycle, timed just before each claim, keeps the comparison fair.
The commissioning baseline
The most undervalued flight in a plant's life is the one at handover. A complete thermal and RGB survey at commissioning records which modules were faulty or damaged from the start, which matters for warranty and defect liability, and it sets the reference against which every later survey is compared. Pair it with a register that ties each module position to its serial number so that a finding years later can be traced to a specific product batch.
What an O&M survey looks for
In operation, losses sit at different levels of the electrical system, and the level decides both how much energy is at stake and who fixes it.
| Level | Typical findings | Best seen in | Why it matters |
|---|---|---|---|
| Cell and module surface | Single hot cells, cracked or shattered glass, burn marks, delamination, heavy soiling or bird droppings | Thermal, confirmed in RGB | Small loss per module, but broken glass and burn marks can be a safety issue |
| Substring | One bypass diode conducting, so part of the module is idle | Thermal | Roughly a third of that module's output lost |
| Whole module | Module disconnected or not contributing | Thermal | Full module output lost |
| String | A row of modules warm together, open circuit or blown fuse | Thermal | Output of the whole string lost |
| Connectors and junction boxes | Hot connectors, failing junction boxes, damaged cables | Thermal, close RGB pass | Fire risk; highest repair priority |
| Inverter or block | A whole block reading uniformly different from its neighbours | Thermal map, plant monitoring data | Large loss, usually already flagged by monitoring |
| Trackers and structure | Rows stuck at the wrong angle, bent tables, loose clamps, corroded posts | RGB orthomosaic | Lower yield, and possible damage in high winds |
| Site | Vegetation shading the lower cells, erosion near piles, damaged fencing, standing water | RGB orthomosaic, terrain model | Gradual loss, access problems and security risk |
Inspect IQ's solar work picks out defective cells, string failures and diode anomalies. YelloSKYE's solar farm thermal inspection work relies on automated detection to pick out three fault classes in particular (hot spots, diode failures and string disconnections), and a single portfolio can produce more than 350,000 images, which is why automated detection with engineering review is the practical way to handle the volume.
Plant monitoring data and the drone survey answer different questions. Monitoring tells you that an inverter or string is down; the drone tells you which module, connector or diode is the cause, and finds the many small losses that never trip an alarm.
Flight conditions that make the data valid
A solar thermal survey flown on the wrong day produces a tidy report that misses most of the faults. These are the conditions to control.
Irradiance
Faults heat up in proportion to the current flowing, so the array must be working hard. IEC TS 62446-3, the technical specification for outdoor thermography of photovoltaic plants, sets a minimum of 600 W/m² on the plane of the modules. Measure it on site with a reference cell or pyranometer at module tilt, not from a weather website, and record it through the flight. On trackers, the modules follow the sun, so plane-of-array irradiance stays high for longer than on fixed tilt.
A stable sky and light wind
Passing cloud changes module temperature within seconds, so one row can look faulty simply because it was flown during a bright spell and its neighbour during a dim one. Wind cools the glass and narrows the temperature differences you are trying to measure. Pick a clear, settled window and stop if the sky or wind changes.
Viewing angle and reflections
Module glass behaves like a mirror. Looking straight down can capture a reflection of the sun, the sky or the drone itself, which appears as a false hot spot. Pilots usually tilt the camera slightly away from perpendicular and plan the flight direction around the sun's position. A spot that moves between overlapping frames is a reflection; one that stays on the same cell is real.
Resolution in two passes
Covering a large plant at the resolution needed to classify every cell would take far longer than the good-weather window allows. Many programmes fly a higher screening pass that finds anomalies at module level, then a lower, closer pass over the flagged areas to classify them. The ground sample distance guide explains how height and sensor set the detail each pass can resolve.
What the RGB and thermal layers each deliver
Flying both cameras on the same flight produces several outputs, each with its own use.
| Deliverable | Sensor | What the O&M team uses it for |
|---|---|---|
| Thermal orthomosaic | Radiometric thermal | Seeing the heat pattern of a whole block at once |
| Anomaly layer | Thermal, with automated detection | The working list of faults, each with a location |
| RGB orthomosaic | Visible | Soiling, vegetation, broken glass, tracker alignment, site damage |
| Close-up stills | Visible and thermal | Classifying a finding before a crew is sent |
| Terrain model | Visible (photogrammetry) | Drainage, erosion near piles, access track condition |
In the solar use case, the drones capture overlapping RGB and thermal imagery without interrupting generation. The visible image is what turns a warm rectangle into a diagnosis: a hot cell under a bird dropping needs cleaning, while the same heat with no visible cause points to a cracked or defective cell.
From anomaly list to repair plan
A survey earns its cost on the day the repair crew uses it.
Address every finding in the plant's own terms
GPS coordinates get a technician to the right spot, but work orders are written in the plant's hierarchy: block, inverter, combiner box, string, table and module position. Map each finding to that hierarchy so it drops straight into the maintenance system without anyone translating coordinates.
Rank by safety first, then by energy
| Priority | Examples | Typical response |
|---|---|---|
| 1: Safety | Hot connectors or junction boxes, burn marks, damaged cables, shattered glass on a live module | Make safe and repair as soon as possible |
| 2: Large energy loss | Strings or blocks offline, several modules disconnected in one area | Schedule within days; check fuses, connectors and inverters |
| 3: Module loss | Active bypass diodes, single modules offline, cracked cells with clear heating | Batch into the next planned repair visit |
| 4: Watch | Mild single-cell heating, light soiling, minor vegetation | Clean or trim on routine cycles; compare on the next survey |
Batch the work
Group repairs by block so a crew isolates each section once, and order replacement modules of the right type in advance. When many findings share a cause, such as one module batch or one cleaning gap, deal with the cause rather than chasing each symptom.
Keep evidence for warranty and insurance
A dated, located record of every finding, with both thermal and visible images, supports module warranty claims and insurance claims after storms. The solar use case notes that a timestamped digital record serves warranty claims, compliance audits and stakeholder reporting. Manufacturers usually still want electrical or laboratory tests on the modules concerned.
Verify the repairs
Re-fly the repaired areas, or include them in the next full survey, and compare. In the DEX platform, each defect sits on the captured plant, dashboards show open findings by severity, and the historical comparison lets you move between survey dates to confirm that a fault is gone or see when it first appeared. Inspect IQ hands the results over as a defect database, each entry carrying marked-up imagery, its GPS position, a severity grade and a suggested fix, and the database exports to PDF, Excel and BIM-linked formats.
How often to fly
Annual full surveys are a common minimum. The YelloSKYE solar use case describes operators flying comprehensive thermal surveys twice a year or quarterly, and puts the saving at 75 per cent of inspection cost against sending ground teams to walk the rows. Add unscheduled flights after hail, strong winds, flooding or fire near the array, before a warranty period ends, and after large repair campaigns. Keep the flight plan, height and time of day the same between surveys so the results stay comparable.
What a drone survey will not tell you
- Hidden cracks without heating. Micro-cracks that are not yet affecting current may show no thermal signature; electroluminescence imaging finds these.
- Exact electrical losses. Thermal patterns indicate the likely fault; string current measurements and I-V curve tracing quantify it.
- Underside and connector detail. Cabling and connectors under the modules are partly hidden from above, so a closer ground check is still needed for some findings.
- Faults on a dull day. No processing can recover contrast that the weather never created.
For the software side of finding faults in thousands of images, see our guide to AI drone inspection.
Solar farm drone programme checklist
- Fly a terrain survey before grading and repeat it until earthworks are signed off.
- Check pile and racking layout against the drawings block by block, before modules go on.
- Time progress flights to land just before each progress payment claim.
- Fly a full thermal and RGB baseline at commissioning and keep the module serial register.
- Schedule O&M thermal surveys only in windows with at least 600 W/m² of steady irradiance and light wind, and log conditions on site.
- Classify every anomaly with the RGB image before it becomes a work order.
- Map findings to block, inverter, string and module position, and rank them by safety then energy.
- Re-fly after repairs and after severe weather, using the same flight plan each time.
Frequently asked questions
Does a solar farm have to be shut down for a drone inspection?
No. A thermal survey only works while the plant is generating, because faulty cells, diodes and strings show up as heat only when current is flowing. The drone flies over the live array and nobody needs to enter the rows, so output is not interrupted.
What irradiance is needed for a thermal solar inspection?
The IEC technical specification for photovoltaic thermography, IEC TS 62446-3, sets a minimum of 600 W/m² on the plane of the modules. Below that, faults produce too little temperature difference to classify reliably. Irradiance should also stay steady during the flight, so log it with a reference cell or pyranometer on site.
How often should a solar farm be inspected by drone?
Many operators fly a full thermal survey once or twice a year, and some fly quarterly on high-value sites. Add flights after hail, high winds or a fire, before a module warranty ends, and after a large repair campaign to confirm the fixes worked.
Can drones be used while a solar farm is being built?
Yes. During construction, drone surveys measure grading and drainage against the design, check pile and racking layout, count installed tables or modules by block for progress claims, and record the as-built plant. A thermal and visual baseline flown at commissioning becomes the reference for every later O&M survey.
Is a drone inspection enough to claim on a module warranty?
It is strong supporting evidence, because each finding is dated, located and photographed in both thermal and visible light. Most manufacturers will still ask for electrical measurements or laboratory tests on the affected modules, so plan those for any batch you intend to claim on.