
Key takeaways
- The Question: What does productivity mean in construction, how do you measure it on a real project, why has the industry fallen behind, and which changes actually improve it?
- The Answer: Productivity is output per unit of input, usually per labour hour. It is measured at three levels: national statistics, company or project totals, and physical output per crew hour on each activity. The site-level figure is the one a project team can act on. Most gains come from removing waiting, rework and poor flow rather than asking crews to work faster.
- The YelloSKYE Angle: Construct IQ measures the output side: drone surveys turn earthworks into volumes, 360° walks show interior work room by room, and fixed cameras record activity in priority zones, all on one dated DEX timeline.
Construction productivity is the ratio between what a project produces and the resources it uses to produce it, most commonly the amount of work installed per hour of labour. A crew placing 120 square metres of slab formwork in 100 worker hours has a productivity of 1.2 square metres per hour; if the next floor takes 80 hours, productivity has improved. Teams that want to improve it need reliable numbers for both sides of that ratio, and the output side is where construction monitoring with Construct IQ plays its part.
This guide covers how productivity is defined and measured, why construction has lagged other industries, where the hours go on a typical site and which levers make a measurable difference. For a full set of project metrics beyond productivity, see our guide to construction KPIs.
Three ways to measure productivity
The word means different things depending on who is measuring. Mixing the three levels is a common source of confusion.
| Level | Typical measure | Used by | Main limitation |
|---|---|---|---|
| Industry | Real value added per hour worked | Economists, governments, industry bodies | Sensitive to price deflators and changes in the type and quality of buildings |
| Company or project | Revenue or contract value per labour hour or per employee | Contractors, owners, investors | Mixes price, scope and subcontracting with genuine efficiency |
| Activity | Physical units installed per labour or crew hour | Site managers, planners, trade contractors | Only comparable within the same activity and conditions |
Industry productivity
National statistics divide the sector's output, adjusted for inflation, by total hours worked. These figures shape the long-running debate about construction's performance, but they are hard to interpret. A modern office building with better insulation, services and safety standards is not the same product as one built decades ago, and the price indices used to strip out inflation do not always reflect that. Economists still argue about how much of the measured stagnation is real.
Company and project productivity
Revenue or contract value per hour is easy to calculate from accounts, and it helps compare business units over time. But a contractor that subcontracts more work, or wins higher-priced contracts, looks more productive without any change on site.
Activity productivity
This is the level a project team controls. It uses physical units, such as square metres of drylining, tonnes of reinforcement fixed, linear metres of pipe or cubic metres of earth moved, divided by the hours spent on them. It is specific, comparable week to week and directly linked to the schedule.
Why construction has lagged other industries
The best-known benchmark comes from the McKinsey Global Institute's 2017 report Reinventing Construction, which found global construction labour productivity had grown by about 1 per cent a year over two decades, while the world economy averaged 2.8 per cent and manufacturing 3.6 per cent. The same report estimated that closing the gap with the wider economy could add around $1.6 trillion a year to the sector's value. The reasons are structural rather than a matter of effort:
- One-off products. Most buildings are prototypes on a new site with a new team, so lessons are hard to carry forward.
- Temporary organisations. A project brings together many firms for a few years and then disbands, taking its learning with it.
- Fragmented contracts. Risk is passed down to subcontractors with thin margins and little capacity to invest.
- Late or incomplete design. Work starts before details are resolved, so crews wait for answers or build things twice.
- Exposure to site conditions. Weather, ground conditions and access all interrupt production.
- Cyclical demand. Boom-and-bust markets discourage firms from investing in equipment, training and technology.
- Weak measurement. Many projects do not record physical output per hour at all, so problems stay invisible.
The MGI report grouped its remedies into seven areas: regulation, contracting and collaboration, design and engineering, procurement and supply chain, on-site execution, technology, and workforce capability. Only some of these are within a project team's reach, but on-site execution and measurement always are.
Where the hours go on a typical site
Work sampling, the practice of recording what a random selection of workers is doing at random moments, consistently shows that a large share of paid time is not spent installing anything. The categories are worth knowing, because each has a different cure.
| Category | What it looks like | Usual cause |
|---|---|---|
| Direct work | Fixing, placing, installing | The productive core |
| Preparation | Setting out, reading drawings, mixing, cutting | Necessary, but can often be done off the critical path |
| Fetching and travel | Walking to stores, carrying materials up floors | Poor logistics and laydown planning |
| Waiting | Standing by for a hoist, an inspection, an answer or a previous trade | Work released before it was ready |
| Rework | Removing and replacing incorrect work | Design errors, poor information, workmanship |
| Breaks and idle time | Unplanned gaps in the shift | Unclear tasks, over-manning |
Direct work is rarely where the improvement lies. Most productivity gains come from shrinking the rows below it.
Measuring productivity at activity level
A workable measurement set-up needs four things defined before work starts.
- The activity and its unit, for example "slab formwork, square metres" or "bulk fill, cubic metres compacted".
- The area, so that output and hours relate to the same place.
- How quantities are measured, ideally from site records rather than percentage estimates.
- How hours are booked, using cost codes that match the activities.
With those in place, track output per hour over time. On repetitive work, a learning curve is normal: the first floors are slower, then the rate stabilises. A sudden drop after that point is a signal worth investigating.
| Floor (illustrative) | Formwork placed (m²) | Crew hours | Output per hour (m²) |
|---|---|---|---|
| Level 1 | 600 | 650 | 0.92 |
| Level 2 | 600 | 560 | 1.07 |
| Level 3 | 600 | 500 | 1.20 |
| Level 4 | 600 | 490 | 1.22 |
| Level 5 | 600 | 610 | 0.98 |
In this illustrative sequence the crew learns over the first three floors, then holds steady. The dip on level 5 should trigger a question: was the crane shared with another trade, did a design change arrive, were materials late? The number does not answer that, but it tells the team where to look.
The performance factor makes different activities comparable: budgeted hours for the quantity actually installed, divided by the actual hours spent. Above 1.0 the work is beating the estimate; below 1.0 it is costing more labour than planned.
Levers that move productivity
Make work ready before crews arrive
The largest single source of lost time on most sites is crews arriving at areas that are not ready: a previous trade unfinished, materials missing, information unresolved. A lookahead plan with a constraint log, reviewed weekly with the trades, attacks this directly. Our lean construction guide explains pull planning and the Last Planner System in detail.
Finish and simplify design earlier
Every unresolved detail becomes a stoppage or a rework risk. Coordinated models, repeated details and design reviews that involve the people who will build the work all reduce the queries that stop crews.
Move work off site
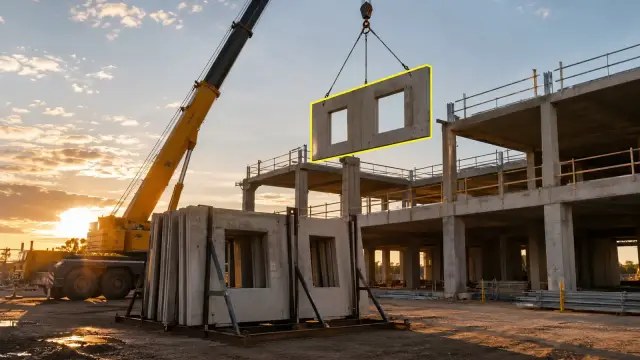
Prefabricated reinforcement cages, bathroom pods, MEP racks and precast elements shift labour hours into factory conditions, where productivity is higher and weather does not interfere. They also reduce the number of people needed on a crowded site.
Plan logistics as carefully as the programme
Hoist time, laydown areas and delivery slots determine how much of a worker's day is spent carrying things. Staging materials close to where they will be used, in the quantities needed for the shift, removes a large amount of fetching.
Size crews to the space and the work
More people only help while there is enough ready work, space and supervision. Past that point, trades crowd each other and output per person falls. Measuring output per crew hour by area shows when that has happened.
Cut rework
Rework consumes hours twice: once to build it wrong and again to put it right. Earlier inspection, clear definitions of done and dated records of what was installed reduce it. Our guide on how to reduce rework covers the methods.
Measure, and feed the numbers back fast
Productivity data that arrives a month later is history. Weekly output figures, shared with foremen in the same meeting where next week's work is planned, give crews a reason to care about them.
Measuring output without arguments
Hours are relatively easy to count. Output is harder, because most projects still estimate installed quantities by eye, and those estimates drift. Construct IQ measures output directly where the work allows it:
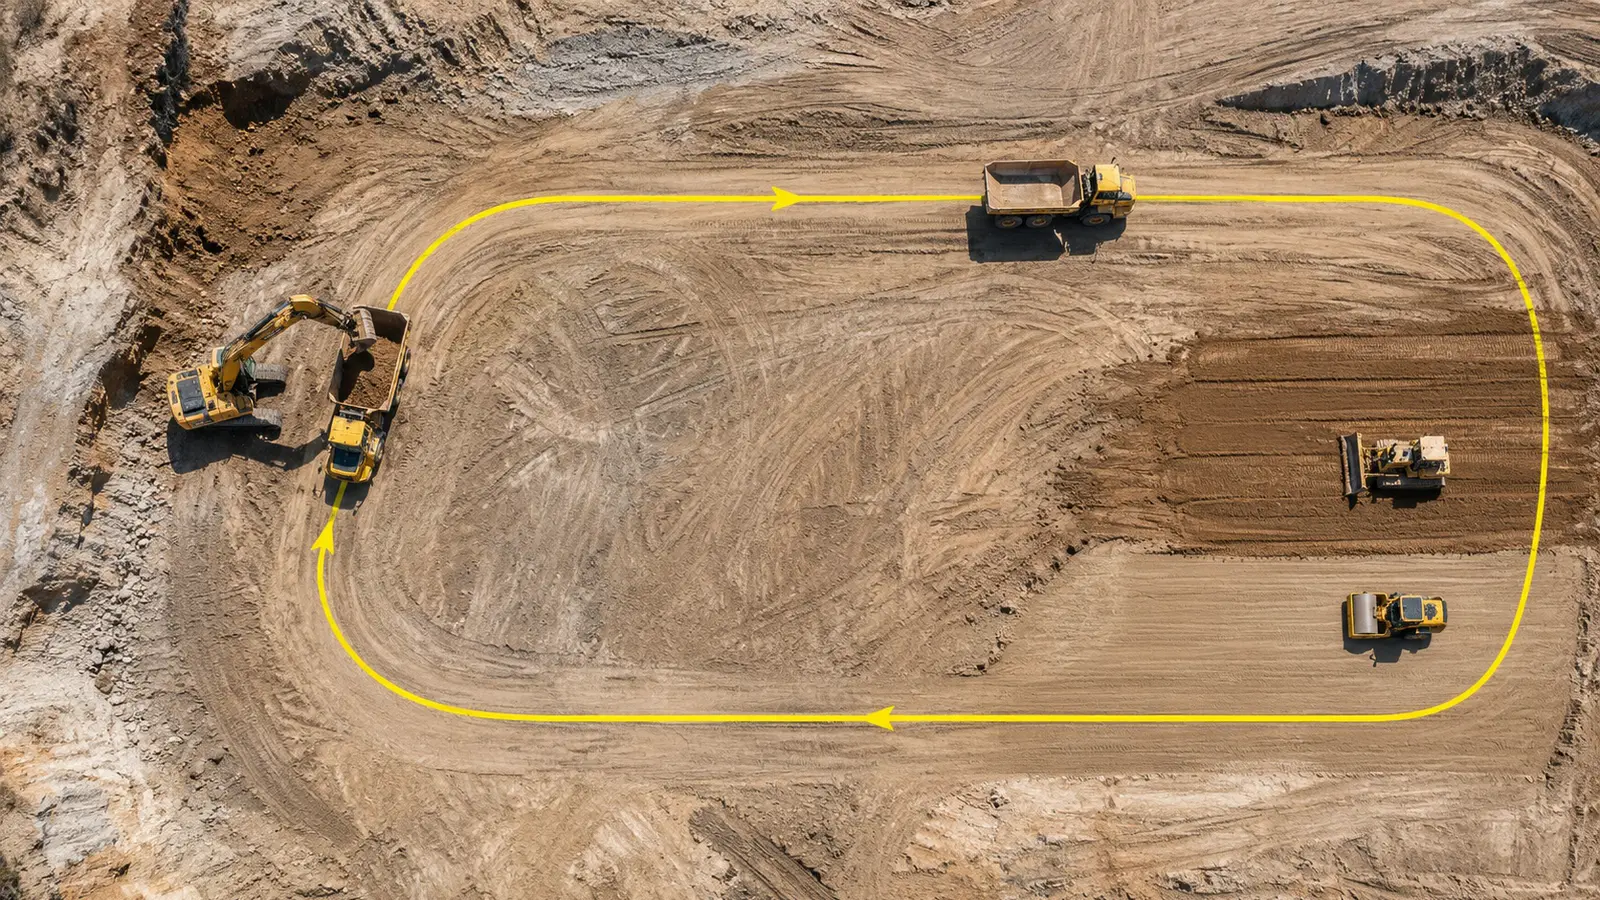
- Earthworks and bulk materials. Drone surveys produce elevation models from which DEX calculates cut and fill against the design levels. In our earthwork volumetric analytics use case, survey turnaround dropped from two weeks to a few hours, which made weekly production rates practical to track.
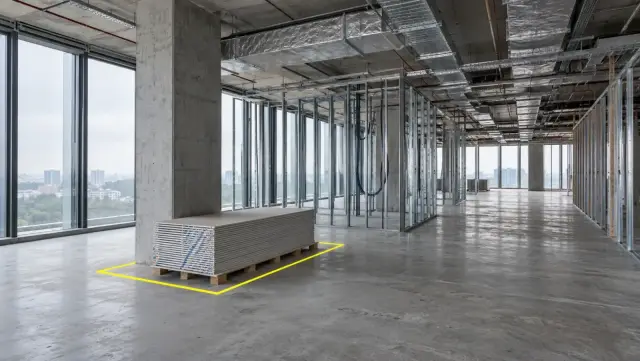
- Interiors. A site team member walks the floors with a 360° camera; no specialist technician is needed. The interior fit-out use case showed a 70 per cent cut in coordination time once every room had a navigable, dated record.
- Priority zones. Fixed cameras record chosen areas at set intervals, and DEX alerts the team if work in a high-priority zone goes quiet, so a stoppage is seen the same day instead of at month end.
All of these sit on one timeline and can be compared with the planned 4D schedule, so the output half of the productivity ratio has evidence behind it. On our aerial progress capture project, replacing manual progress reporting with weekly flights freed more than 15 hours of site management time per week, which is itself a productivity gain for supervisors.
Common mistakes when chasing productivity
- Pushing for speed instead of removing waiting. Telling crews to work harder rarely helps when they are waiting for access or information.
- Comparing unlike work. Output per hour from a simple warehouse cannot be a target for a hospital.
- Measuring hours without quantities. Hours alone show cost, not productivity.
- Ignoring quality. A crew that installs faster but fails inspection more often is not more productive.
- Collecting data nobody reviews. Measurement only pays off if it changes next week's plan.
Next steps for your project
- Pick three to five repetitive activities on the critical path and define their units of output.
- Align cost codes so labour hours are booked to the same activities and areas.
- Set up a capture routine that measures installed quantities rather than estimating them.
- Track output per hour and the performance factor weekly, and expect a learning curve on early repetitions.
- Review the figures with foremen alongside the lookahead plan, and ask what stopped work when a rate dips.
- Tackle the biggest non-productive category first, usually waiting or rework, before asking for more speed.