
Key takeaways
- The Question: What data does a construction project produce, why is so little of it used, and what does it take to turn it into analysis that changes decisions?
- The Answer: Projects generate large volumes of schedule, cost, design, site and quality data, mostly in unstructured files. Analytics starts with structure: common location and activity codes, a date and place on every record, agreed definitions and a simple data model. With that in place, teams can move from describing what happened to explaining, forecasting and recommending, and AI has something reliable to learn from.
- The YelloSKYE Angle: Construct IQ produces site data that arrives already structured: every capture dated, geo-referenced and comparable with the schedule and BIM model.
Construction data analytics means organising the information a project produces, such as its schedule, costs, quantities, site records, design models and quality logs, so that it can be compared, measured and used to make decisions. The analysis itself is rarely the hard part. The hard part is that most construction data is created in forms no software can join together: photos without locations, PDFs, free-text reports and spreadsheets with private naming.
This guide covers the data a project generates, why most of it stays unstructured, how to structure it, the four levels of analytics, data quality and governance, and why this groundwork decides whether AI tools are any use. Site capture is one of the largest and least structured data sources on a project, which is where Construct IQ fits.
The data a project produces
A mid-size building project generates data from dozens of companies, every day, for years. It falls into a handful of groups.
| Data group | Examples | Usual format | Structured? |
|---|---|---|---|
| Schedule | Activities, durations, logic, baselines, updates | Scheduling software files | Mostly |
| Cost and commercial | Budgets, commitments, payment claims, variations | Accounting systems, spreadsheets | Partly |
| Design | Drawings, BIM models, specifications, revisions | CAD, model files, PDFs | Models yes, drawings and specs largely no |
| Site record | Photos, daily reports, drone surveys, 360° walks, laser scans | Images, point clouds, free text | Rarely, unless captured with location and date |
| Quality and safety | Inspections, defects, non-conformances, incidents | Forms, checklists, spreadsheets | Partly |
| Correspondence | Queries, instructions, minutes, emails | Documents and email | No |
| Resources | Crews, plant, deliveries, materials on site | Reports, delivery notes | Rarely |
Industry research suggests the cost of getting this wrong is large. A 2021 study by FMI and Autodesk, Harnessing the Data Advantage in Construction, estimated that poor-quality data cost the global construction industry around US$1.85 trillion in 2020, mostly through rework and bad decisions.
Why most construction data stays unstructured
Several features of the industry work against structure.
- Every project is a temporary organisation. Owners, designers, contractors and dozens of subcontractors come together for a few years, each with its own systems, then disperse.
- Records are made for people, not software. A site diary written for the next shift is readable but not countable. A photo taken to show a colleague a problem has no zone, activity or reference attached.
- Names differ. One firm's "Level 3 east" is another's "L03-Z2". Without a shared location breakdown, records about the same place cannot be matched.
- Definitions differ. "Complete" can mean installed, tested, inspected or accepted. Two reports that both say 80 per cent may be measuring different things.
- Data is collected for the moment. A spreadsheet built to answer this month's question is abandoned next month, so history is lost.
Structuring the data: from spreadsheets to a data model
Structure does not need a big system at the start. It needs a few rules applied consistently.
Agree the keys everything hangs on
Three shared breakdowns let records from different sources be joined:
- Location: site, building, level, zone. Keep it the same across the schedule, the model, the cost plan and the site record.
- Work: activity or work package codes that match the schedule.
- Cost: cost codes that map to work packages.
Give every record a date, a place and an activity
A photo becomes data when it carries a capture date, a position and the activity it relates to. A defect becomes data when it has a location, a trade, a status and a date raised and closed. This one rule turns a large share of unstructured records into usable ones.
Write down definitions
Define what counts as started, complete, inspected and accepted for each type of activity. Define how quantities are measured. Put the definitions where everyone who records data can see them.
Move from loose spreadsheets to linked tables
A simple data model has a handful of entities: projects, zones, activities, elements or quantities, observations (progress, defects, issues) and documents. Each observation links to a zone and an activity. This can live in a database, a construction management platform or, at small scale, a well-built set of linked sheets. What matters is that the links exist.
Turn images into measurements
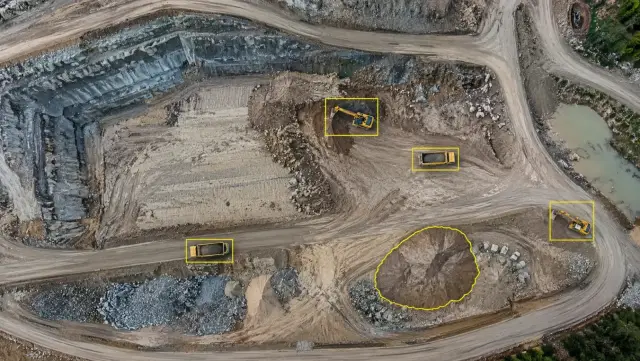
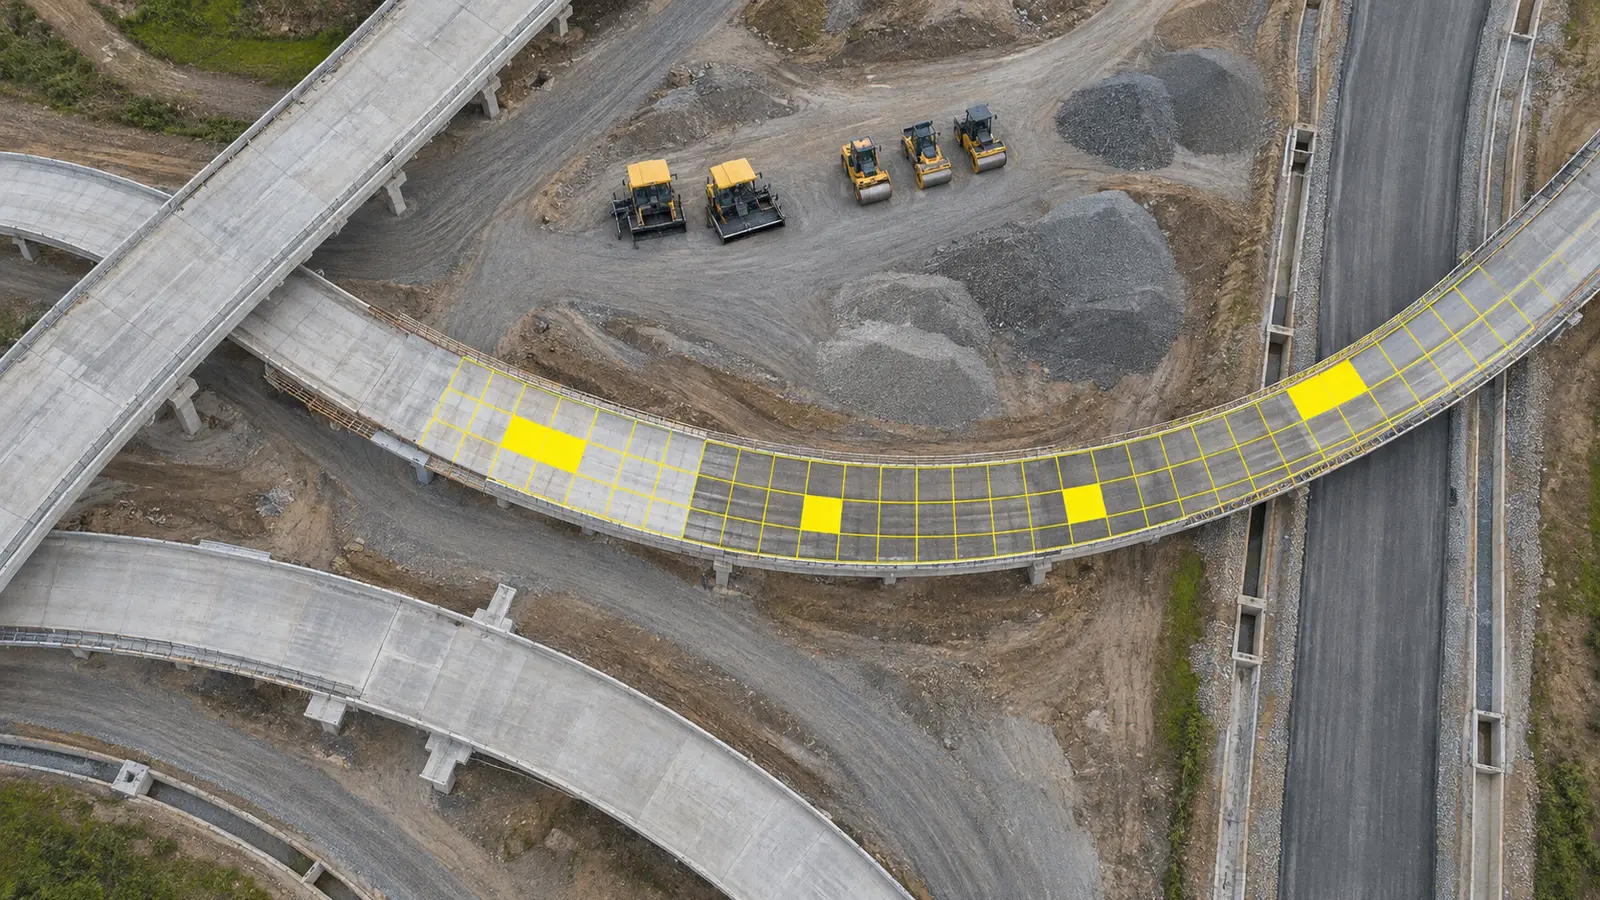
Site imagery is the richest source of truth on a project and the least structured. Processing changes that. Drone images become orthomosaics and terrain models from which areas and volumes can be measured; laser scans become point clouds that can be compared with the design model; 360° walks become a navigable record placed on the floor plan. In our as-built vs BIM clash detection use case, laser scan point clouds were overlaid on the design models so deviations surfaced before following trades built over them.
The four levels of analytics
Once data is structured, analytics can climb four levels. Each depends on the one below.
| Level | Question it answers | Construction example | What it needs |
|---|---|---|---|
| Descriptive | What happened? | Installed quantities by zone this month; defects raised per trade | Consistent recording with dates and locations |
| Diagnostic | Why did it happen? | Ceiling closure late because services sign-off waited on open queries | Links between progress, constraints and correspondence |
| Predictive | What is likely to happen? | Fit-out on Level 5 will finish two weeks late at current pace | Regular, measured progress over time; history |
| Prescriptive | What should we do? | Moving a second crew to Level 5 recovers the milestone without delaying Level 6 | Predictive models plus resource and logic data |
Most projects work at the descriptive level and stop. The step to diagnostic is the most valuable for site teams, because it turns a list of late activities into a list of causes someone can fix. Our guide on as-built vs as-planned shows the comparison that sits underneath most of these questions.
Data quality: the part nobody budgets for
Analysis of poor data produces confident wrong answers. Five qualities are worth checking.
| Quality | What it means on a project | A simple check |
|---|---|---|
| Accuracy | The record matches the site | Spot-check reported progress against site evidence each month |
| Completeness | Every zone and activity is covered | Count zones with no update in the last two weeks |
| Timeliness | Data arrives while it can still change a decision | Measure the gap between site event and record |
| Consistency | The same thing is recorded the same way everywhere | Check location and activity codes against the agreed lists |
| Lineage | You can tell who recorded it, when and from what source | Every record carries author, date and source |
Objective sources help with accuracy and consistency. A drone survey measures the same way every flight; a person estimating percentages does not. The portfolio monitoring use case shows the effect at scale: because each site was flown, walked and filmed to the same specification, leadership worked from one baseline and could review over ten sites in half an hour.
Governance: who owns the data
Governance sounds bureaucratic, but on a project it comes down to a few decisions made early.
- Ownership. Who owns each data set, and who may change it?
- Standards. Which location, activity and cost codes apply, and which file formats are accepted? Information management standards such as ISO 19650 give a framework for this on BIM projects, though requirements differ by country and client.
- Contract terms. Require subcontractors and consultants to deliver structured data, not just files. A schedule of required data fields in the subcontract costs little and saves a lot later.
- Access and security. Who can see commercial data, site imagery and models, and how is that controlled?
- Retention. How long is data kept after handover, and in what form, so the next project can learn from it?
At company level, governance is what lets you compare projects. If every project uses its own codes, the company has fifty data sets rather than one.
The foundation AI needs
AI tools in construction, from schedule forecasting to image recognition, learn patterns from data. They need large amounts of consistent, labelled history, and they need current data that resembles what they learned from. A firm whose past projects sit in incompatible spreadsheets cannot train a useful model, and buying a more advanced tool does not change that. Our guide to AI in construction looks at which applications work today.
The practical order is: structure, then quality, then descriptive and diagnostic analytics, then prediction and AI. Skipping steps is the most common reason analytics projects stall.
Where YelloSKYE fits
YelloSKYE turns the site record, usually the least structured data on a project, into data that is ready to analyse. Each drone flight, 360° walk, fixed-camera image and laser scan is dated and tied to a position on site. DEX lines up those captures with CAD and BIM models, calculates volumes and keeps a timeline that can be scrolled day by day. In our earthwork volumetric analytics use case, DEX calculated cut and fill against the design grading plan from each new survey, so quantity data no longer waited weeks for a manual survey. Because the progress data can be exported to Procore and Autodesk Construction Cloud, it sits alongside the schedule and cost records your team already keeps.
A starting checklist
- List the data your project produces and who creates each set.
- Agree one location breakdown and use it in the schedule, model, cost plan and site record.
- Make date, location and activity mandatory on every progress, quality and site record.
- Write down what "complete" means for each activity type.
- Link records in a simple data model before buying analytics tools.
- Check data quality monthly against site evidence.
- Put structured data requirements into subcontracts.
- Keep project data in a form the next project can use.