Drone Pavement Condition Survey for Car Parks, Yards and Access Roads
By Kush Agarwal, President and CEO, YelloSKYE. Published .
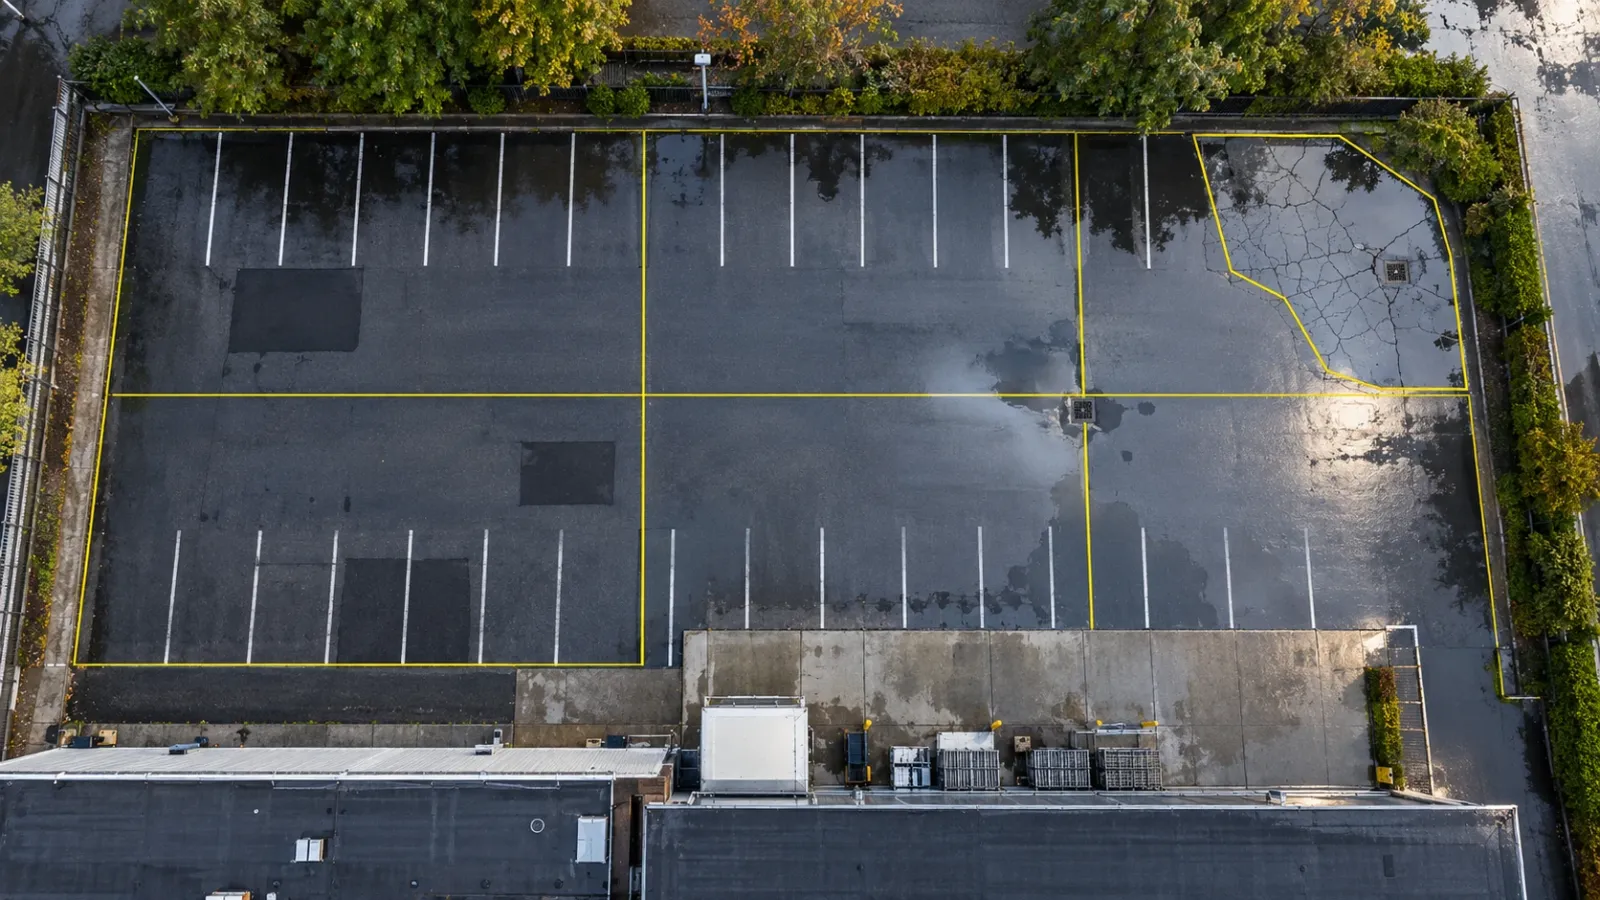
Executive Summary
- The Question: How do you survey a car park, yard or private access road with a drone, and turn what you see into a maintenance plan?
- The Answer: Fly a low, controlled mapping survey when the surface is empty, map every distress by type, severity and extent, rate each section of paving, and choose treatments by section. The map becomes both the condition record and the quantity take-off for the repair contract.
- The YelloSKYE Angle: Inspect IQ records paved areas alongside the buildings they serve, and DEX lets the owner measure areas on the map, tag defects where they sit and compare one survey date with the next.
A drone pavement condition survey maps the whole surface of a car park, service yard or access road at high resolution, so that every crack, pothole, patch and puddle can be located, measured and rated. Compared with walking the site with a clipboard, it captures the entire area in one visit, and the result is a scaled map that maintenance contractors can price from.
YelloSKYE captures paved areas as part of its Inspect IQ asset inspection work, usually alongside the roofs and facades of the same property. This guide covers the private and commercial paving that owners and facility teams are responsible for: what distress to look for, what resolution and timing the survey needs, how to rate condition, and how to turn the map into a costed plan. For how the map itself is produced, see our guide to what an orthomosaic is.
Why paved areas are worth surveying properly
Paving is easy to ignore until it fails. A car park cracks slowly for years, then water gets into the base, the cracks link up and potholes appear within a season. At that point the repair has moved from cheap surface sealing to digging out and rebuilding.
The difficulty is that a walking inspection is slow on a large area and is usually done between parked vehicles. Inspectors end up sampling a few sections and extrapolating. A drone map removes the sampling: every square metre is in the record, at the same scale, with each defect in its true position.
That matters for three reasons:
- Liability. Trip hazards and potholes in areas used by the public or by staff are a safety question as much as a maintenance one. A dated map shows what was known and when.
- Budgeting. Repair costs depend on area. Measured areas of each defect type give a realistic budget instead of a lump-sum guess.
- Timing. Catching sections while they still need only preventive work is where most of the saving in pavement maintenance lies.
The distress you are looking for
Pavement engineers describe surface problems by type, severity and extent. The type tells you the likely cause; severity and extent tell you how urgent and how large the repair is.
Asphalt surfaces
| Distress | What it looks like from above | Likely cause | Visible on a drone map? |
|---|---|---|---|
| Fatigue (alligator) cracking | Interconnected cracks forming small polygons, often in wheel paths | Repeated loading on a weak base or thin surface | Yes, clearly at fine resolution |
| Block cracking | Larger rectangular pattern across the surface | Asphalt shrinking and hardening with age | Yes |
| Longitudinal and transverse cracks | Single cracks along or across the direction of traffic | Poor joints, shrinkage, movement below | Yes, if wider than about a pixel |
| Edge cracking | Cracks near the unsupported edge of paving | Weak edge support, drainage at the verge | Yes |
| Potholes | Bowl-shaped holes, often dark or holding water | Water entry through cracks, then traffic | Yes |
| Ravelling | Rough, pitted surface where aggregate has come loose | Ageing binder, poor compaction | Yes, as a change in texture |
| Rutting and depressions | Channels in wheel paths, shallow dips | Deformation of surface or base | Partly; needs elevation data or ponding |
| Bleeding | Shiny, black patches of binder on the surface | Too much binder in the mix | Yes |
| Patch deterioration | Earlier repairs that have cracked or settled | Poor repair or continuing base failure | Yes |
Concrete surfaces
Concrete yards, loading aprons and some car park decks fail differently. Look for cracked or broken slabs, corner breaks, spalling along joints, steps between neighbouring slabs (faulting) and failed joint sealant. Many of these are clear from the air; steps between slabs usually need elevation data or a ground check.
The things around the surface
A pavement survey should also record what controls its life: gullies and channels that are blocked or sit higher than the surface around them, kerbs that are broken or displaced, faded markings, tree roots lifting the surface, and drainage outlets. A failing gully often explains the failing paving next to it.
Resolution, timing and flight settings
The map is only useful if the smallest distress you care about is visible. That is set by the ground sampling distance (GSD), the size of ground covered by one pixel. Our guide to ground sample distance explains the relationship between flight height, camera and GSD in detail.
| What you need to see | Indicative GSD | Practical note |
|---|---|---|
| Potholes, large patches, ponding, markings | Around 2 to 3 cm per pixel | Higher, faster flights; suits a quick annual overview |
| Cracking patterns and ravelling | Around 1 cm per pixel or finer | The usual target for a condition rating |
| Crack widths for repair specification | Finer than 1 cm per pixel | Low flights; check against tape measurements on site |
These are working guides rather than fixed thresholds. Camera, light and surface colour all change what is visible, so run a short test flight over a known crack before committing to a whole site.
When to fly
- Empty surface. Parked vehicles hide the paving and cast shadows. Early mornings, weekends or a closure arranged with the occupier give the cleanest map.
- Dry for cracks. A dry surface shows cracks and texture best. Low, raking sun adds shadow inside cracks and helps them stand out.
- After rain for drainage. A short pass shortly after rain shows where water stands, which is the quickest way to find depressions and blocked gullies.
- Avoid long building shadows across the area, which hide detail and confuse automated analysis.
Control and repeatability
If the map will be compared with next year's, or used for measured quantities, tie it to ground control or RTK positioning so each survey lands in the same coordinates. Without control, two maps can look similar and still be offset, and changes become hard to trust. Plan the flight around everything the property will need: the same flight can also feed the roof and site record in a wider property condition assessment.
Using elevation as well as the image
The orthomosaic shows what the surface looks like. The elevation model from the same flight shows its shape, which is where some of the most expensive problems appear.
- Rutting and depressions show up as low areas in the surface model, often before they are obvious in the image.
- Falls and drainage paths can be checked across the whole surface, so you can see where water will collect and whether gullies sit at low points.
- Settlement around manholes, gullies and service trenches shows as local dips.
The same terrain-based approach underpins YelloSKYE's work on flood risk and drainage planning, where water flow is simulated over a drone-derived terrain model. On a car park the scale is smaller, but the question is the same: where will the water go?
From defects to a condition rating
A map full of marked cracks is a record, not a decision. To plan work, the surface is split into sections and each section gets a rating.
Divide the surface into sections
Make each section reasonably uniform: one aisle of a car park, the heavy-vehicle yard, the access road, the loading apron. Sections that carry different traffic or were built at different times deteriorate differently and should be rated separately.
Record type, severity and extent
For each section, measure how much of each distress type is present and at what severity. On a scaled map this is a matter of drawing polygons and lines: square metres of fatigue cracking, linear metres of transverse cracks, the count and area of potholes.
Turn the record into a score
Many owners use the Pavement Condition Index (PCI), which rates a section from 0 to 100 using standard deduction tables for each distress type and severity; ASTM D6433 sets out the method for roads and car parks. Others use a simpler banded scale. Either works if it is applied the same way every time. A simple banded version might look like this:
| Condition band | What the surface shows | Typical treatment |
|---|---|---|
| Good | Sound surface, a few fine cracks | Routine crack sealing, keep drains clear |
| Fair | Widening cracks, early ravelling, small patches | Crack sealing plus a surface treatment or seal coat |
| Poor | Fatigue cracking, potholes, failing patches | Patch repairs and a new surface course |
| Very poor | Widespread fatigue cracking, rutting, base failure | Mill and resurface, or rebuild the affected areas |
Automated crack detection can speed up the mapping on large sites, but treat its output as a draft for a trained reviewer to check, particularly on stained, patched or shadowed surfaces.
Planning maintenance from the map
The value of the survey shows up when the ratings become a programme of work.
Match treatment to condition
Treatments are cheapest when applied early. A section rated fair that is sealed now may hold for years; left alone, it can drop to poor and need resurfacing. The plan should deliberately spend on keeping good and fair sections in that state, not only on fixing the worst.
Price from measured quantities
Because every polygon on the map has an area, the repair schedule can be written as quantities by section: square metres of patching, linear metres of crack sealing, square metres of resurfacing. Contractors price the same quantities, tenders become comparable, and fewer variations appear once work starts.
Phase the work around operations
A car park or yard usually has to stay open. Use the map to group work into zones that can be closed one at a time, and to schedule the noisiest or longest jobs for quiet periods. Pair paving work with any drainage fixes in the same zone, so new surfacing is not laid over a gully that still fails.
Plan several years, not one
Combine the ratings with an expected rate of decline to set out treatments over the next few years. The first year deals with safety items and failing sections; later years hold the rest of the surface in good condition. Revisit the plan after each survey rather than treating it as fixed.
Re-survey and compare
Fly the same area on a regular cycle, often once a year, and after major works. Comparing two dated maps shows whether repairs held and how fast each section is changing, which is the evidence needed to refine the next budget. YelloSKYE's automated asset inspection approach is built on this: every finding sits at a coordinate, so it can be found and checked again. For long private roads, the same corridor approach used in linear corridor mapping keeps a narrow, extended survey manageable.
What a drone pavement survey does not cover
- What lies below. A crack pattern points to base failure; only cores, trial pits or ground-penetrating radar show its depth and cause.
- Structural capacity. Whether a yard can carry heavier vehicles is an engineering assessment, not a visual one.
- Skid resistance. Polished surfaces need friction testing.
- Underground services. Settlement over a trench shows on the map; the cause sits in the pipe below.
- Public roads. Highways owned by a public authority follow that authority's inspection regime. This guide is about paving you own or manage.
Pavement survey checklist
- Define the area: car parks, yards, access roads, aprons, footways.
- Arrange an empty surface and confirm flight permissions with the national aviation authority.
- Set the GSD for the smallest distress you need to see, and test it over a known crack.
- Fly with ground control or RTK so future surveys align.
- Add a short pass after rain to record ponding.
- Split the surface into uniform sections and record distress type, severity and extent in each.
- Rate each section on one consistent scale.
- Choose treatments by section and write the schedule as measured quantities.
- Phase work into zones the site can live with.
- Re-survey on a fixed cycle and compare dates before setting the next budget.
Frequently asked questions
What is a pavement condition survey?
It is a systematic record of the distress on a paved surface, such as cracking, potholes, rutting and ponding, measured by type, severity and extent. The results are turned into a condition rating for each section of pavement, which is then used to decide what treatment each section needs and when.
What resolution do I need for a drone pavement survey?
To see cracks reliably, aim for a ground sampling distance of about 1 cm per pixel or finer, which means flying low. Coarser maps still show potholes, patches and ponding, but fine cracking starts to disappear. If you want to measure crack widths rather than just map cracks, plan for a finer resolution still and check it against a few measurements on the ground.
Can a drone survey replace a walking pavement inspection?
For recording surface distress, largely yes, and it covers the whole area rather than a sample. It cannot tell you about the layers beneath the surface, skid resistance or load-bearing capacity, so cores, testing or a site walk are still needed where the surface suggests a deeper problem.
What is a Pavement Condition Index?
The Pavement Condition Index, or PCI, is a widely used rating that scores a section of pavement from 0 to 100 based on the types, severities and quantities of distress observed. Many owners use it, or a simpler local scale, to compare sections, set maintenance priorities and track how quickly a surface is deteriorating.
When is the best time to fly a car park survey?
When the car park is as empty as possible, so vehicles do not hide the surface. Dry conditions give the clearest view of cracks, while a pass shortly after rain shows where water collects. Many owners combine the two, flying the main survey on a dry, quiet morning and adding a quick ponding check after the next shower.