
Key takeaways
- The Question: How can a construction team keep an accurate picture of who is on site and where, turn that into useful measures of output, and do it in a way workers accept?
- The Answer: Choose a tracking method that matches the purpose, from simple sign-in for safety rolls to access control and zone tags for detailed analysis. On its own, headcount only measures effort. Paired with measured progress for the same area and period, it gives output per crew and exposes idle time and overcrowding. Privacy must be designed in from the start.
- The YelloSKYE Angle: YelloSKYE does not track individual workers. Construct IQ supplies the other half of the picture: a dated record of what was built, from drone flights, 360° walks and fixed cameras on DEX, which can be set beside headcount data from your access or timesheet system.
Construction workforce tracking means recording how many people are on site, which trade and company they belong to, where they work and for how long. Most sites already collect some of this, through sign-in sheets, turnstiles or foremen's daily headcounts, but few connect it to what those people actually produced. The real value appears when headcount is set against measured progress for the same area and period, which is where a visual progress record from Construct IQ complements whatever system counts the people.
This guide compares the main tracking methods, shows how to turn headcount into output per crew, explains how to spot idle time and overcrowding, and covers the safety uses and the privacy rules that apply.
Why sites track their workforce
The purpose decides the method, so it is worth being explicit about which of these you need:
- Emergency roll call. Knowing who is on site, and roughly where, so everyone can be accounted for after an evacuation.
- Access and compliance. Making sure only inducted people with valid training cards and certifications enter, and that restricted areas stay restricted.
- Subcontractor verification. Checking that the crew sizes a trade contractor promised, or bills for on a labour basis, are actually on site.
- Productivity measurement. Relating hours worked to output installed, by trade and area.
- Logistics planning. Sizing welfare facilities, hoist capacity and parking to the real peak population.
- Site security. Keeping unauthorised people off an inherently hazardous site.
A roll call needs a reliable count at the gate. Productivity analysis needs trade, area and hours. Trying to serve every purpose with the cheapest method usually serves none of them well.
Tracking methods compared
| Method | What it records | Accuracy | Effort to run | Privacy footprint |
|---|---|---|---|---|
| Foreman headcount in the daily report | Number of workers per trade per day | Moderate; depends on the foreman | Low | Low |
| Paper or app sign-in | Names, company, time in and out | Moderate; people forget to sign out | Low to moderate | Moderate |
| Access cards at turnstiles | Individual entry and exit times, company, trade | High at the perimeter | Moderate; needs a controlled boundary | Moderate |
| Biometric gates | Verified individual entry and exit | Very high at the perimeter | Moderate to high | High; biometric data |
| Wearable zone tags | Which zone or floor a worker is in, and for how long | High inside the site | High; hardware and charging | High; location data |
| Anonymous counting from cameras | Number of people in a view, no identity | Moderate; depends on views | Moderate | Lower if designed without identification |
| Timesheets and payroll | Paid hours by person and cost code | High for hours, weak on location | Low; already exists | Moderate |
Headcounts and sign-in
A daily headcount from each foreman is cheap and familiar, and our guide to the construction daily report covers how to record it well. Its weakness is that it is self-reported by the people being measured, and it rarely says where the crew worked.
Access control
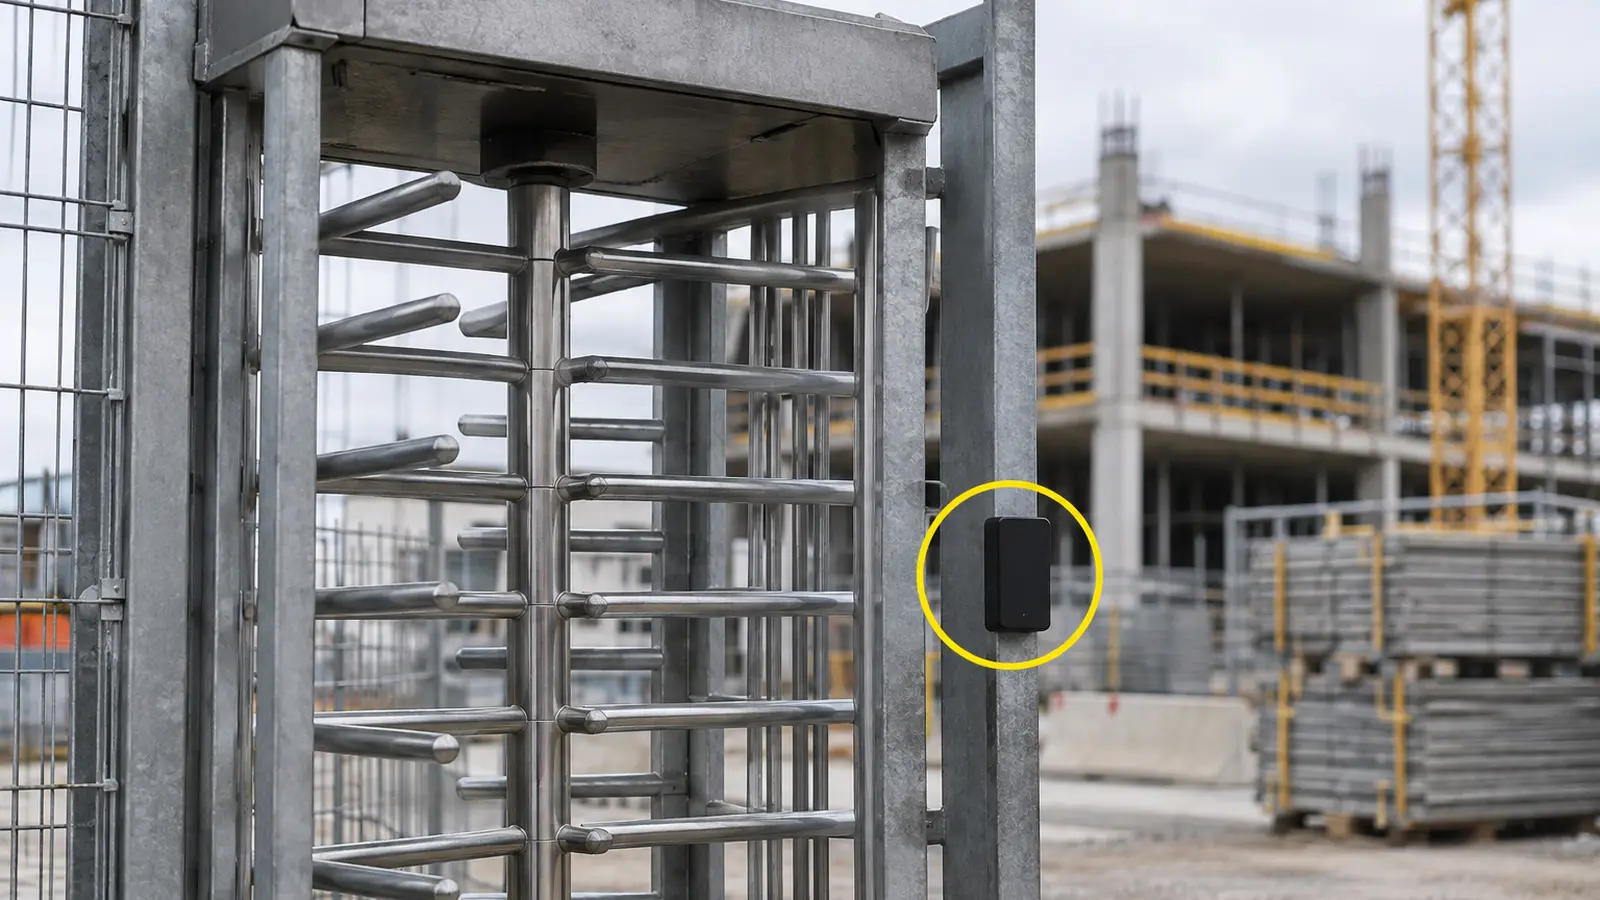
Turnstiles with cards give an accurate record of who entered and left, which is the foundation for emergency roll calls and for checking subcontractor numbers. They only work where the site has a controlled perimeter; open linear sites such as roads or pipelines need other approaches, such as sign-in at each work front.
Zone tags and sensors
Wearable tags using short-range radio or similar technology can show which floor or zone a worker is in. This is the most detailed data and the most sensitive, so it needs the strongest case and the clearest consent process. It also needs a plan for charging, lost tags and coverage in areas where signals drop out.
Camera-based counts
Some sites count people in a camera view without identifying them. This gives a sense of crowding by area with a smaller privacy footprint, provided the system is set up so individuals cannot be picked out and the footage is handled under clear rules.
Turning headcount into output per crew
Headcount measures effort, not results. A floor with twelve drylining operatives on it every day for a week might be going well, or might be stuck. The useful measure is output per crew, which needs two inputs for the same area and period:
- Crew hours or crew days from the tracking system, by trade and area.
- Quantity installed in that area, measured rather than estimated.
| Zone (illustrative) | Trade | Crew days in week | Quantity installed | Output per crew day |
|---|---|---|---|---|
| Level 3 east | Drylining | 10 | 420 m² | 42 m² |
| Level 3 west | Drylining | 10 | 410 m² | 41 m² |
| Level 4 east | Drylining | 12 | 250 m² | 21 m² |
| Level 4 west | Drylining | 6 | 260 m² | 43 m² |
In this illustrative week, level 4 east had the most crew days and the lowest output. Something stopped the crew there: a services clash, missing boards, an inspection hold or another trade in the way. The workforce data found the problem area; it does not explain the cause.
The weak half of this calculation is usually the quantity installed. Many sites still estimate it as a percentage, which makes output per crew day as uncertain as the estimate. Measured progress from dated site capture closes that gap. Our guide to construction productivity covers how to set up activity-level rates.
Spotting idle time and overcrowding
Once headcount and progress sit side by side, several patterns become visible:
- High headcount, flat progress. Crews are present but blocked, usually by an area that was released before it was ready.
- Many trades in one zone. Trade stacking, where several crews share a small area and slow each other down.
- Headcount below the committed crew size. A subcontractor short of labour, which will show up as slippage a week or two later.
- Large swings from day to day. Crews being moved between projects, causing stop-start progress.
- Peaks that exceed welfare or hoist capacity. Queues for lifts and facilities that eat into productive hours.
Site imagery helps explain what the numbers point to. In our fixed-camera monitoring use case, cameras record chosen zones at set intervals, and Construct IQ can flag when activity stops in a zone marked high priority. Combined with scheduled drone capture and the DEX platform, that set-up has reduced site visits by up to 80 per cent in verified YelloSKYE deployments, because managers can check a suspicious area remotely before deciding whether to go. A weekly drone flight adds a measurable picture of the whole site; on our aerial progress capture project it took more than 15 hours of manual reporting off site managers each week.
Safety uses
Safety is often the reason tracking is introduced, and it is the use workers most readily accept.
- Evacuation and muster. A live count of who is inside the perimeter makes roll calls faster and more reliable.
- Induction and competence checks. Entry can depend on a completed induction and current training cards.
- Restricted zones. Access to areas such as live electrical rooms, confined spaces or crane exclusion zones can be limited to authorised people.
- Lone working. Knowing that someone is working alone in a remote part of the site allows check-in routines.
- Fatigue. Hours on site per person help enforce limits on long shifts and consecutive days.
Our guide to construction safety monitoring covers how site imagery supports the physical conditions side of safety, such as edges and exclusion zones.
Privacy, consent and trust
Workforce tracking collects personal data, and in some forms it collects sensitive data such as biometrics and location. The rules differ by country and region. The EU and UK GDPR are one widely known example; they require a lawful basis, transparency, data kept to what is necessary and limits on how long it is held. Other jurisdictions have their own laws, and some have specific rules for biometric data or for monitoring at work. Collective agreements and works councils may also need to be consulted.
Whatever the local rules, a few principles keep tracking lawful and accepted:
- State the purpose and use the data only for that purpose. Data collected for roll calls should not quietly become a disciplinary tool.
- Collect the minimum. If zone-level crowding is the question, anonymous counts may be enough.
- Prefer aggregate reporting. Output per crew and headcount per trade rarely need individual names.
- Set retention periods and delete data when they expire.
- Tell people and involve them. Explain the system at induction, consult worker representatives and give a route for questions.
- Secure the data and limit who can see individual records.
- Handle site imagery the same way. Progress cameras capture people incidentally, so agree viewpoints, access and retention with the same care.
Trust matters for practical reasons too. Workers who believe tracking is used against them find ways around it, and the data stops being accurate.
Setting up workforce tracking: a checklist
- Write down the purposes in order of priority: safety, compliance, subcontractor checks, productivity.
- Choose the lightest method that meets the top purposes, and add detail only where there is a clear use for it.
- Check the legal position in your jurisdiction and consult workers or their representatives.
- Define zones and trades consistently between the tracking system, the programme and the cost codes.
- Pair headcount with measured progress for the same zones and periods, using a dated capture routine.
- Report output per crew weekly and review it with trade foremen, not just in the office.
- Investigate patterns, not individuals. Use high-headcount, low-output zones as prompts to find and remove the constraint.
- Review retention and access every few months and delete what is no longer needed.