Drones in Agriculture: How Farms and Estates Use Them, and How to Start
By Kush Agarwal, President and CEO, YelloSKYE. Published .
Executive Summary
- The Question: What do farms and rural estates actually use drones for, which sensors matter, and what is a sensible first step?
- The Answer: A drone gives a measured view of a whole field or estate on the day you choose. Growers use it to map crop vigour, divide fields into zones that are managed differently, find drainage and terrain problems, count plants and trees, and record damage. Spraying is possible but tightly licensed. In every case the map tells you where to look; ground checks and agronomic advice tell you what to do.
- The YelloSKYE Angle: YelloSKYE does not provide agronomy or crop advice. Where we fit is the land itself: Survey IQ surveys an estate's boundaries, acreage, terrain, drainage paths and land cover, and keeps each survey in the DEX platform as a dated, georeferenced record.
Drones in agriculture are used to look at a whole farm from above, measure how the crop and the ground vary across it, and direct people and inputs to the parts that need them. A walk along the headland shows the edge of a field; a drone map shows the middle, the far corner and the wet patch nobody reaches until harvest.
This guide covers the main agricultural uses, from crop health mapping to regulated spraying, explains what the sensors and indices really measure, and sets out how to get started. One point up front: crop and agronomy analysis is a specialist field, and YelloSKYE does not offer it. Our part is surveying the land underneath, through Survey IQ, which is covered later for estates that need boundaries, terrain and drainage measured.
The main jobs drones do on farms and estates
Most agricultural drone work falls into a handful of jobs. They differ in the sensor they need, the point in the season they matter and how much field work they still require.
| Job | Typical sensor | What you get | When it matters | What still needs a person on the ground |
|---|---|---|---|---|
| Crop vigour mapping | Multispectral, or RGB to start | Vegetation index map of the field | Mid-season, before input decisions | Finding the cause of weak areas |
| Variability zones | Multispectral plus field history | Zone map for scouting or variable-rate work | Planning fertiliser, seed or crop protection | Soil samples, agronomist sign-off |
| Drainage and terrain | RGB photogrammetry or LiDAR | Terrain model, low spots, flow paths | Off-season, before drainage or levelling work | Checking outfalls, pipes and ditches |
| Plant and tree counts | High-resolution RGB | Counts, gaps, row spacing | Early emergence, orchard or plantation audits | Spot counts to confirm the model |
| Damage records | RGB orthomosaic | Area affected by storm, hail, flood or wildlife | Soon after the event | Insurer or assessor inspection |
| Spraying and spreading | Spray or spreader drone, not a mapping drone | Treated area log | Targeted treatments, hard-to-reach ground | Licensed operator, product rules |
| Estate land survey | RGB photogrammetry with ground control | Boundaries, acreage, terrain, land cover | Purchase, sale, planning, infrastructure | Legal boundary confirmation |
Crop health mapping: what the camera actually sees
A crop health map is built from how leaves handle light. Chlorophyll absorbs most of the red and blue light that hits a leaf and uses it for growth. The internal structure of a healthy leaf bounces near-infrared light back strongly, even though our eyes cannot see it. When a plant is short of water or nutrients, diseased or simply thin on the ground, red absorption weakens and near-infrared reflection drops, often before the crop looks any different to a person standing in it.
NDVI and the red-edge band
The Normalised Difference Vegetation Index (NDVI) puts this into one number per pixel: near-infrared minus red, divided by near-infrared plus red. Values run from minus one to plus one; bare soil sits near zero and dense green canopy climbs towards the top of the range. Mapped in colour, NDVI makes thicker and thinner parts of a field stand out at a glance.
NDVI has a known weakness. Once the canopy closes, it saturates, so a good crop and a very good crop look the same. Indices that use the red-edge band, such as NDRE, keep separating plants later in the season and respond more directly to chlorophyll content, which is why many growers switch to them as the crop matures.
Indices from an ordinary camera
A standard colour camera has no near-infrared band, but indices such as VARI work from red, green and blue alone. They are noisier and more sensitive to changing light, yet they cost nothing extra and show the obvious problems well: emergence gaps, weed patches, waterlogged strips and lodged crop. Starting with the camera you already own is a reasonable way to learn what the maps can and cannot tell you before buying a multispectral payload.
Light, calibration and timing
Every index depends on sunlight, and sunlight changes. A cloud passing halfway through a flight can make one half of a field look stressed. Multispectral systems handle this with a sunlight sensor on top of the drone and a calibration panel photographed before take-off, which together convert raw values into reflectance that can be compared between dates. Even then, fly at a similar time of day each visit, avoid patchy cloud where you can, and keep the flight height and overlap constant. The resolution you choose sets how fine a detail you can resolve; our ground sample distance guide explains the trade-off between height, detail and coverage.
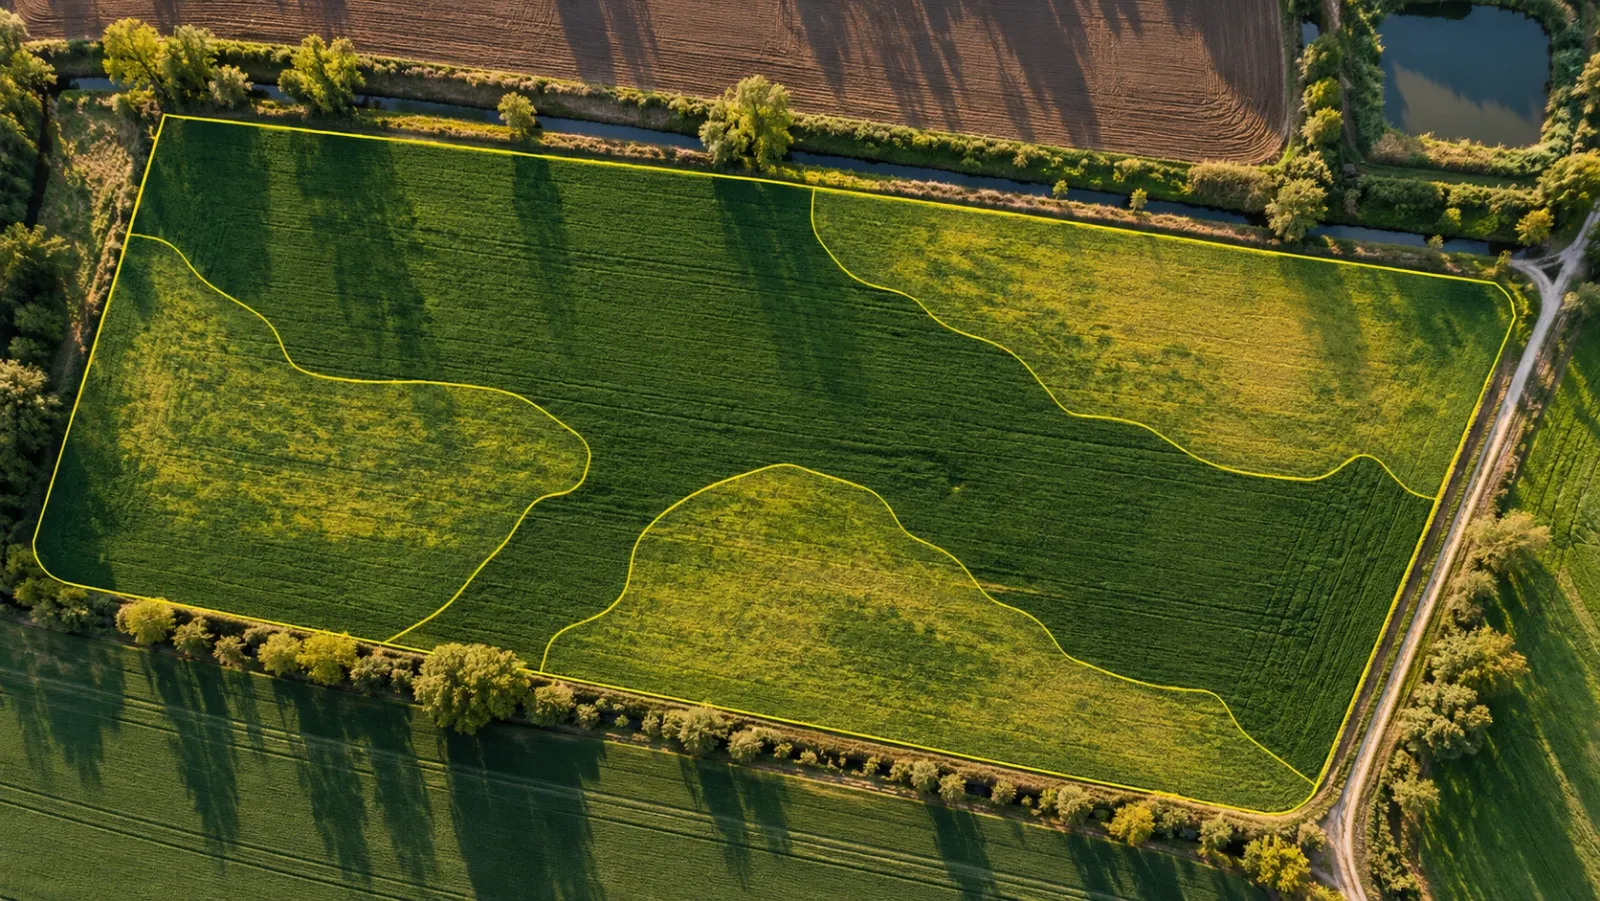
From a colour map to management zones
A vigour map on its own is a picture. It becomes useful when the field is divided into a few zones that will be treated differently, and when someone has checked what is happening in each one.
Ground truth before action
Treat every low-scoring patch as a question. Walk to it with the map on a phone, look at the plants and the soil, and record what you find. Common causes include compaction along old tracks, poor drainage, a missed strip at drilling, pest or disease pressure, sandy or shallow soil and nutrient shortage. Only some of these respond to more fertiliser, which is why agronomists insist on a field check before any prescription is written.
Building zones that last
The most dependable zones combine several layers: this season's vigour map, yield records from previous harvests, soil sampling or conductivity surveys and the farmer's own knowledge of the field. Areas that come out weak year after year usually point to soil or water, not to this season's management. Areas that move around from year to year point to weather, pests or timing.
What the zones are used for
- Directed scouting, so the agronomist's limited time goes to the patches that matter.
- Variable-rate application, where zone boundaries are exported to the farm's machinery or farm management software to change seed, fertiliser or crop protection rates across the field.
- Trials and product comparison, where repeated flights over side-by-side strips show which variety or treatment held its vigour longer.
- Harvest planning, where maturity or drying across fields decides the order the combine visits them.
Terrain, water and field layout
Crop problems are often water problems in disguise. A field that ponds in the same corner every wet spell, or a slope that sheds topsoil into a ditch, shows up first as a weak patch on a vigour map. Fixing it needs the shape of the ground, not just the colour of the crop.
A photogrammetric drone survey with ground control produces a bare-earth terrain model of the field, and from that come contours, slope maps and low points. Running a water flow simulation over the terrain traces where rainfall will travel and gather, which is what you need to site new ditches, size a pond or plan field drainage. Images of bare soil after rain sometimes reveal old drainage pipe runs as faint lines. Terrain models also guide land levelling and the layout of tracks and terraces. For how the terrain survey itself is carried out and specified, see our drone topographic survey guide.
Our flood risk and drainage planning use case shows this method on development land: a Survey IQ terrain model with water flow simulation identifies where water accumulates and which channels carry it before any drainage design is fixed. The same outputs answer the drainage questions an estate manager asks about farmland.
Counting plants, trees and gaps
High-resolution colour imagery taken soon after emergence lets software count plants row by row, measure the gaps between them and estimate population per hectare. Uneven emergence spotted early still leaves time to decide whether to replant. In orchards, vineyards and plantations, the same approach counts trees or vines, finds missing ones and measures canopy size, which supports replanting plans, yield estimates and asset records. Counts are only as good as the detail in the images, so fly low enough for individual plants to be clearly separate, and check a few sample rows by hand.
Spraying and spreading: a regulated job
Spray drones carry tanks, pumps and nozzles, and spreader drones carry granular fertiliser or seed. They suit small or steep fields, wet ground that machinery cannot cross, and spot treatment of patches found on a map. They are not mapping drones, and they come with a different level of regulation.
Two sets of rules usually apply at once. The aviation side covers carrying and releasing a payload, flying heavy aircraft low over land, and often operating near people and roads; in the United States, for instance, drone spraying is treated as an agricultural aircraft operation with its own certification. The product side covers which chemicals may be applied from the air, by whom and with what buffer zones; European Union law prohibits aerial spraying of pesticides unless a member state grants a specific derogation. Requirements vary widely between countries and even regions, so confirm both before planning spray work, and use a licensed operator if you are not one.
Choosing sensors
| Sensor | Measures | Good for | Limits |
|---|---|---|---|
| RGB camera | Visible colour at fine detail | Counts, weeds, damage, orthomosaics, terrain models | Indices are sensitive to light; stress shows late |
| Multispectral camera | Red, green, red-edge and near-infrared bands | Vigour maps, early stress, comparing dates | Coarser detail; needs calibration |
| Thermal camera | Canopy and surface temperature | Water stress, irrigation faults, wet ground | Time of day and weather change readings |
| LiDAR | Laser ranges to ground and canopy | Terrain under crops and trees, canopy height | Cost; no plant health information |
Thermal cameras work because a crop short of water closes its pores, cools itself less and runs warmer than its neighbours. Readings change through the day, so the same timing rules apply as for any thermal survey; our drone thermal inspection guide explains the conditions that matter.
Surveying the estate itself: where YelloSKYE fits
Agronomy aside, farms and rural estates have the same land questions as any other landholding. How large is it really, and where do the boundaries run on the ground? Which areas are productive land, woodland, water or hard standing? How does water move across it, and what would it cost to reshape part of it for a new building, reservoir or road?
These are land survey questions, and they are what Survey IQ is built to answer. A single drone mobilisation produces a georeferenced orthomosaic with boundary coordinates overlaid, DTM and DSM terrain models with contours, a land use and land cover classification separating vegetated, water-body, open and encumbered ground, and a water flow simulation showing drainage paths and flood-prone areas. Using RTK-GNSS drones together with ground control points, Survey IQ reaches sub-5 cm horizontal and vertical accuracy, and outputs export to the CAD and GIS formats surveyors and planners already use. Formal boundary demarcation still needs a licensed surveyor in most places; the drone survey shows whether the ground and the documents agree.
This matters most when an estate changes hands, is split, or has part of its land planned for another use such as housing, solar or infrastructure. In our pre-acquisition drone land survey work, that full dataset is delivered 5× faster than a conventional ground survey, before the purchase decision is made. Each survey sits in the DEX platform as a dated record, so a later survey of the same estate can be compared with it. For tracking vegetation, erosion and water across seasons, see our guide to environmental monitoring with drones.
How to start
A first drone programme works best when it is tied to one decision rather than a general wish to see the farm from above.
- Name the decision. Replant or not, where to scout, which fields to drain first, which strip in a trial performed best. The decision sets the sensor, the timing and the detail you need.
- Start with what you have. Fly a colour orthomosaic of one or two fields and learn to read it before investing in multispectral or spraying equipment.
- Check flying regulations. Confirm what your national aviation authority requires for commercial or farm use, including any pilot certificate, registration and limits near roads, buildings and livestock.
- Fix the method. Same height, overlap, time of day and calibration routine on every visit, so maps compare properly.
- Ground-truth everything. Visit flagged patches, record what you find and keep those notes with the map.
- Combine layers. Put drone maps alongside yield history, soil data and machinery records before setting zones.
- Bring in specialists where needed. Use an agronomist for crop decisions, a licensed operator for spraying, and a surveyor for terrain, drainage and boundary work.
- Keep the record. Store each survey by field and date so changes over seasons can be measured, not remembered.
Frequently asked questions
What are drones used for in agriculture?
The common uses are mapping crop vigour across a field, marking out zones that need different treatment, finding wet spots and drainage problems on a terrain model, counting plants or trees, recording storm or flood damage and, where permitted, spraying. Most of the value comes from seeing the whole field at once and then sending people to the places the map points to.
Do I need a multispectral camera to check crop health?
Not to begin with. An ordinary colour camera can show stand gaps, weeds, lodging and visible discolouration, and some vegetation indices work from colour bands alone. A multispectral camera adds near-infrared and red-edge bands, which pick up stress earlier and compare more reliably between dates, so it is worth adding once you know what decisions the maps will drive.
What does NDVI show on a farm?
NDVI is a number for each pixel that compares near-infrared and red reflectance, and it rises with the amount of green, active leaf. On a map it shows where the crop is thicker or thinner than the rest of the field. It does not say why, so a low patch still needs someone to walk it and find out whether the cause is water, nutrients, pests, soil or something else.
Is it legal to spray crops with a drone?
It depends on the country. Spraying combines aviation approval for carrying and releasing a payload with pesticide or fertiliser regulation, and both usually require licences beyond an ordinary drone permit. Some jurisdictions restrict aerial application of pesticides altogether, so check with the aviation authority and the agriculture or environment regulator before buying equipment.
Is a drone better than satellite imagery for monitoring crops?
They suit different jobs. Satellite imagery is cheap and regular for broad field-by-field trends, but its pixels are metres across and cloud can block it for weeks. A drone flies when you need it, under cloud if necessary, at centimetre detail, which makes it the better tool for checking individual problem areas, trial plots, plant counts and drainage.